ARCHIVED - Canada’s Energy Futures 2020 Supplement: Natural Gas Production
This page has been archived on the Web
Information identified as archived is provided for reference, research or recordkeeping purposes. It is not subject to the Government of Canada Web Standards and has not been altered or updated since it was archived. Please contact us to request a format other than those available.
Canada’s Energy Futures 2020 Supplement: Natural Gas Production [PDF 357 KB]
Data and Figures [EXCEL 5 021 KB]
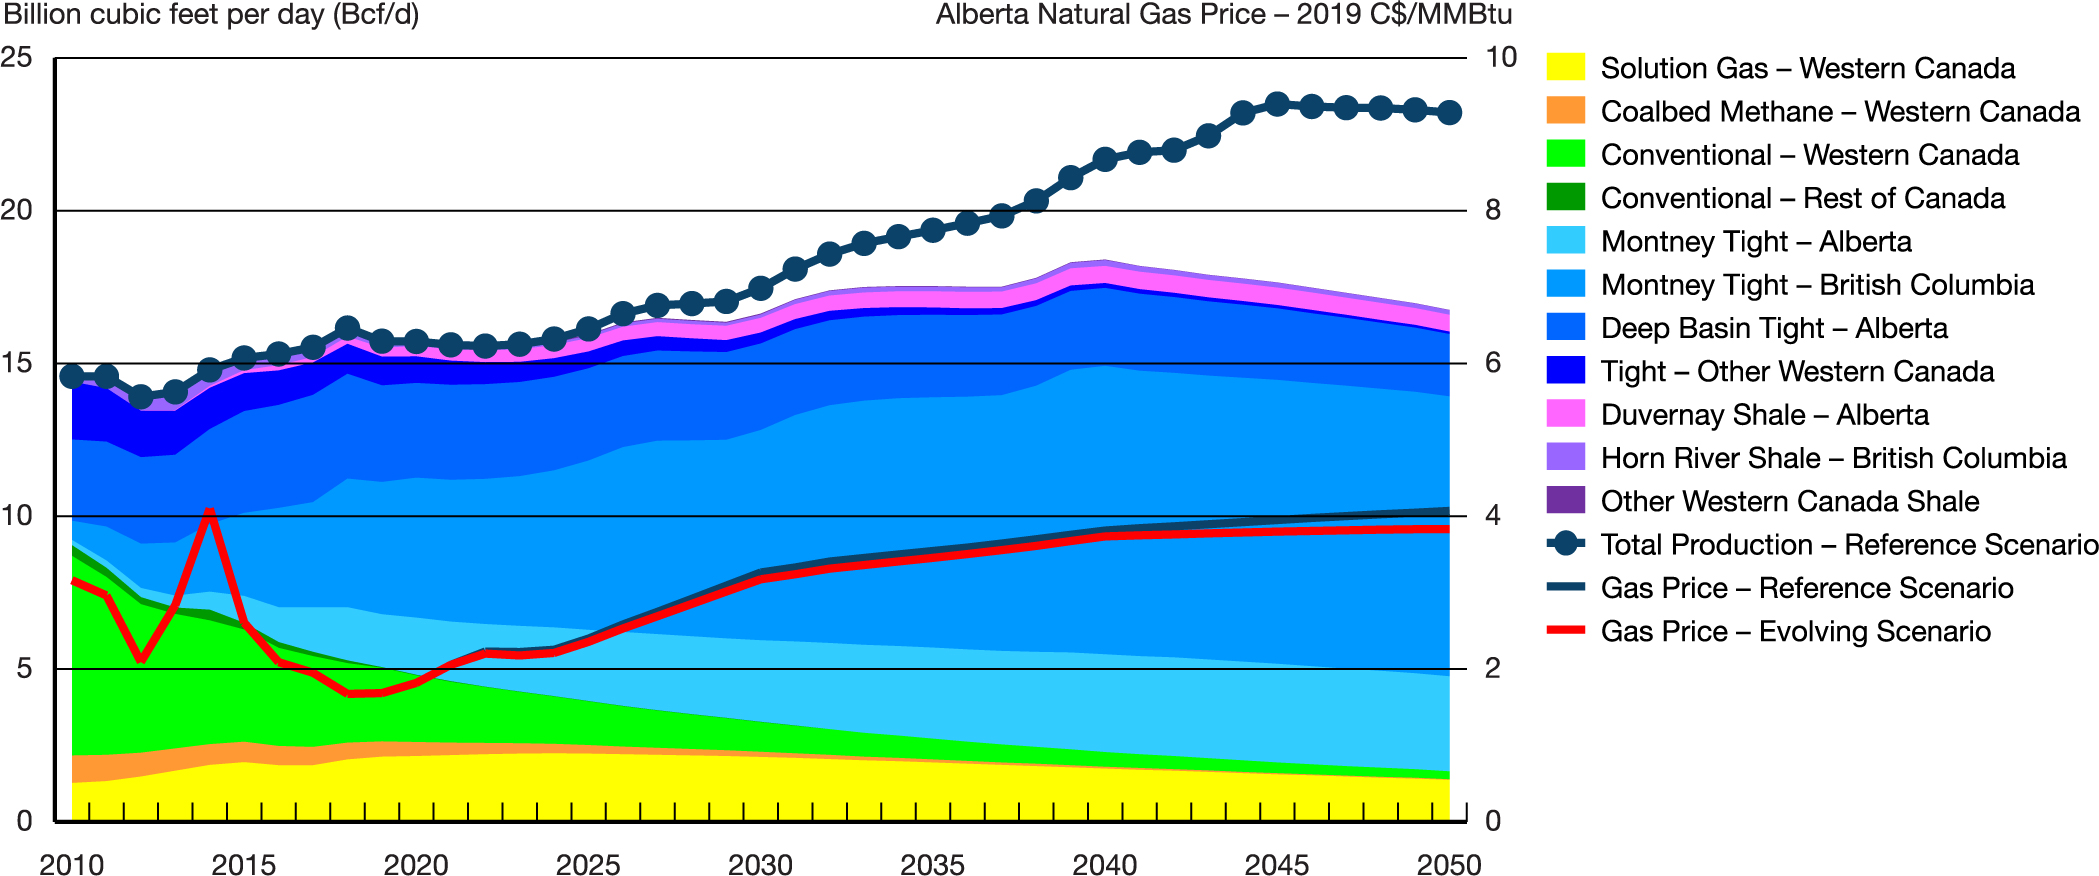
Marketable Natural Gas Production — Evolving Scenario
Description:
This chart shows the production of natural gas in Canada from 2010 to 2050, from all its various extraction methods and regions for the Evolving Scenario. This chart also shows total production for the Reference Scenario and natural gas prices for both scenarios. Western Canada solution gas grows from 1.3 Bcf/d in 2010 to 1.4 Bcf/d in 2050. Western Canada coal bed methane declines from 0.1 Bcf/d in 2010 to 0.02 Bcf/d in 2050. Western Canada conventional declines over the projection from 7 Bcf/d in 0.3 Bcf/d in 2050. Conventional natural gas production from the rest of Canada declines from 0.3/d in 2010 to 0 Bcf/d by 2032. Alberta Montney production is 0.2 Bcf/d and grows to 3 Bcf/d by 2050 while BC Montney production is 0.6 Bcf/d in 2010 and reaches 9.2 Bcf/d by 2050. Alberta Deep Basin production is 2.7 Bcf/d in 2010 and declines to 2.0 Bcf/d by 2050 while tight gas from other western Canada plays declines from 1.9 Bcf/d in 2010 to 0.1 Bcf/d by 2050. The Duvernay shale play begins production in 2012 and grows to 0.6 Bcf/d by 2050 while the Horn River shale play begins production in 2010 at 0.17 Bcf/d and is 0.15 Bcf/d in 2050. Other western Canada shale plays account for less than 0.05 Bcf/d throughout the projection. Total production is 15.7 Bcf/d in 2020 and increases to 16.8 Bcf/d in 2050 in the Evolving Scenario and 23.2 Bcf/d in 2050 in the Reference Scenario. The Alberta natural gas price is $3.16 (2019 C$/MMBTU) in 2010, $1.82 in 2020, and in 2050 the price is $3.83 in the Evolving Scenario and $4.07 in the Reference Scenario.
In the Evolving Scenario, natural gas production from new wells is just enough to keep pace with the declining production from existing wells in the near term. As a result, total production is level until 2025. In the longer term, rising prices and the onset of liquefied natural gas (LNG) exports support higher capital expenditure and production growth. Tight gas continues to have an increasing share of production, while conventional production continues declining. The Evolving Scenario assumes lower gas prices, higher carbon costs, and lower LNG exports than the Reference Scenario.
| Evolving Scenario | 2010 | 2020 | 2030 | 2040 | 2050 |
|---|---|---|---|---|---|
| Canadian Gas Production, marketable Bcf per day | 14.6 | 15.7 | 16.6 | 18.4 | 16.8 |
| Conventional | 6.9 | 2.2 | 1.0 | 0.5 | 0.3 |
| Montney Tight | 0.8 | 6.4 | 9.6 | 12.6 | 12.3 |
| Alberta Deep Basin Tight | 2.7 | 3.1 | 2.8 | 2.5 | 2.0 |
| Solution Gas | 1.3 | 2.1 | 2.1 | 1.7 | 1.4 |
| Other | 3.0 | 1.8 | 1.1 | 1.0 | 0.8 |
| AB Reference Gas Price, 2019 C$ per mmBtu | $3.16 | $1.82 | $3.18 | $3.74 | $3.83 |
| Henry Hub Price, 2019 US$ per mmBtu | $5.45 | $2.05 | $3.35 | $3.75 | $3.75 |
| Gas Wells, average per year | 9 146 | 870 | 1 353 | 1 102 | 823 |
| Gas Drill Days, average per year | 65 865 | 24 719 | 38 780 | 31 265 | 23 503 |
| Average Drill Days per Well | 7.2 | 28.4 | 28.7 | 28.4 | 28.5 |
| Average Initial Production Rate per Well, mmcf per day | 0.98 | 2.74 | 2.86 | 3.02 | 3.02 |
| LNG Exports, Bcf/d | 0.00 | 0.00 | 2.30 | 4.88 | 4.88 |
73% Montney’s share in 2050 |
4.9 Bcf/d LNG Exports by 2039 |
Reference Scenario in 2050:
23 Bcf/d production 7.1 Bcf/d LNG exports |
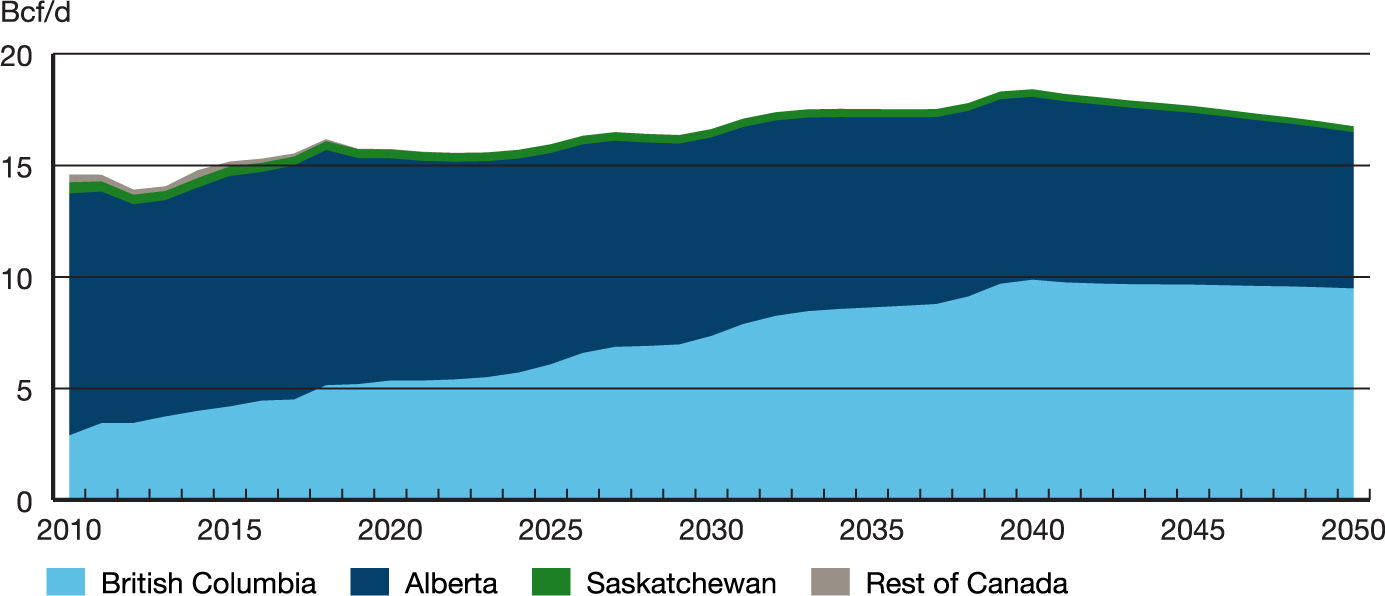
Marketable Natural Gas Production by Area — Evolving Scenario
B.C. continues to have the strongest growth and becomes the largest producer by 2035.
Description:
This chart shows production of natural gas in Canada by province and territory. British Columbia produced 2.9 Bcf/d of natural gas in 2010, growing to 9.5 Bcf/d by 2050. Alberta production declines from 10.8 Bcf/d in 2010 to 7.0 Bcf/d in 2050. Saskatchewan production is 0.5 Bcf/d in 2010 and declines to 0.3 Bcf/d by 2050. Northern Canada, Ontario, New Brunswick, Nova Scotia and Newfoundland combine to produce only 0.3 Bcf/d in 2010 and decline to 0 Bcf/d by 2032.
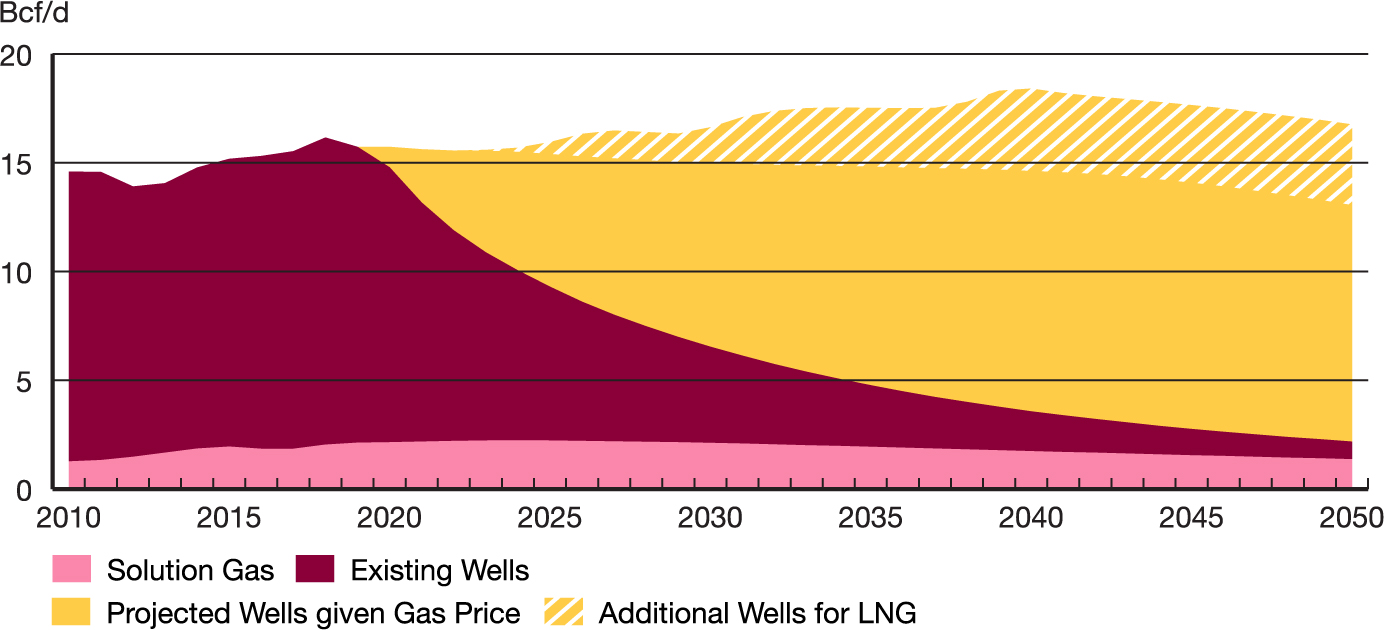
Western Canadian Marketable Natural Gas Production by Well Vintage — Evolving Scenario
In the longer term, additional production for LNG exports keeps total production above current levels.
Description:
This chart shows the amount of natural gas that comes from wells of differing types and ages. Solution gas, gas that comes from oil wells, produce 1.3 Bcf/d in 2010 and is 1.4 Bcf/d in 2050. Gas that comes from wells that have already been drilled totals 13.3 Bcf/d in 2010 and falls to 0.8 Bcf/d by 2050. New wells are projected to produce 0.9 Bcf/d in 2020 and grow to 10.9 Bcf/d by 2050. Future wells that are drilled as a result of liquefied natural gas activity begin producing natural gas in 2023 and grow to 3.7 Bcf/d by 2050.
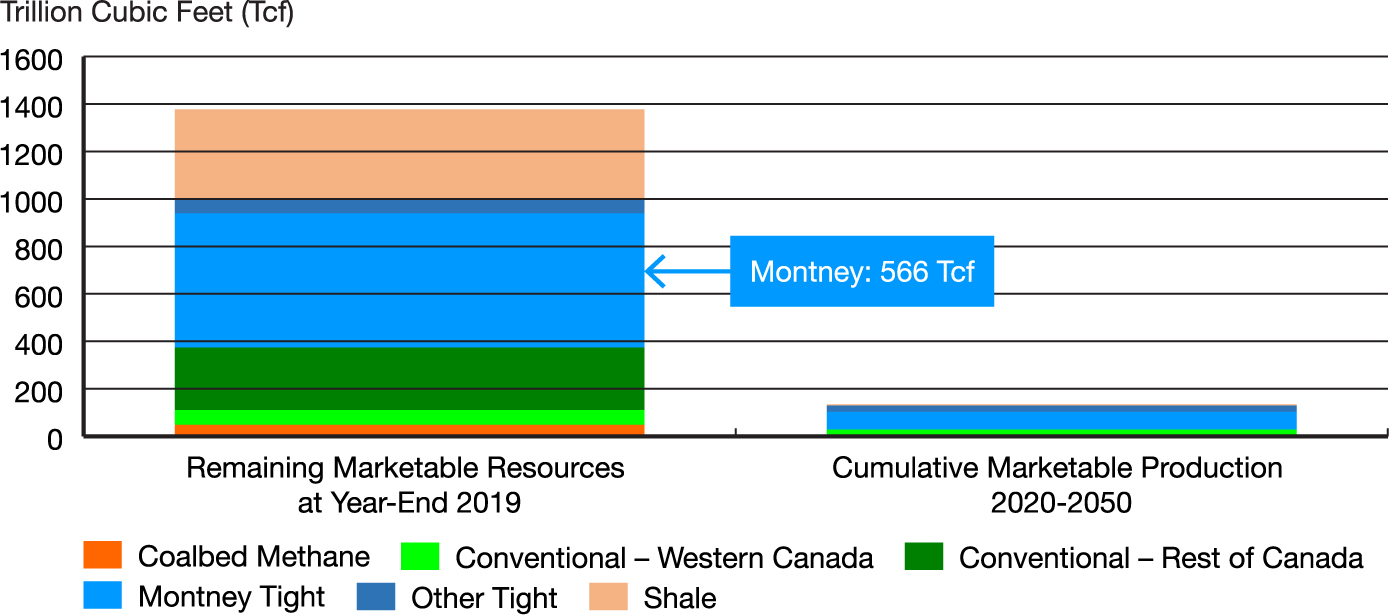
Natural Gas Resources vs. Cumulative Production
In the Evolving Scenario only 10% of resources in Canada are produced over the projection.
Description:
This chart shows the natural gas resources in Canada at year-end 2019 along with the cumulative production from 2020 to 2050. Coal bed methane resources total 47.7 Tcf. Western Canada conventional account for 62.9 Tcf. Rest of Canada conventional has 263 Tcf. Montney Tight gas has 566 Tcf of gas resources. Other tight resources account for 58.1 Tcf. Shale resources amount to 380 Tcf. Production amounts to only 10% of the resources available by the end of the projection period in 2050.
Find the Report Appendix data at
https://apps.cer-rec.gc.ca/ftrppndc/dflt.aspx?GoCTemplateCulture=en-CA
- Date modified: