ARCHIVED – Fact Sheet - Canada’s Energy Future 2016: Energy Supply and Demand Projections to 2040 - Electricity Highlights
This page has been archived on the Web
Information identified as archived is provided for reference, research or recordkeeping purposes. It is not subject to the Government of Canada Web Standards and has not been altered or updated since it was archived. Please contact us to request a format other than those available.
Canada’s Energy Future 2016: Energy Supply and Demand Projections to 2040 provides projections of Canadian energy supply and demand to the year 2040. Canada’s Energy Future 2016 includes a baseline projection, the Reference Case, based on the current macroeconomic outlook, energy price projections, and government policies and programs that were law or near-law at the time the report was prepared. EF 2016 includes additional projections that vary assumptions on energy prices, energy markets, and infrastructure. For detailed information on Electricity, see Chapter 8 of the full report.
Future electricity capacity additions are dominated by renewables and natural gas
- In 2014, installed electricity generation capacity in Canada reached 140 GW. Hydroelectricity remains the primary source of electric power, accounting for 55 per cent of total capacity. Natural gas, coal, and nuclear plants provide most of the remaining supply, while non-hydro renewables such as wind, solar, and biomass make up eight per cent of capacity. New Capacity is added to replace retiring units and meet growing demand. As existing facilities age, they need to be replaced for reliability, economic and/or environmental reasons. In addition, sufficient capacity needs to be constructed to meet growing demand and maintain adequate capacity beyond peak demand requirements.
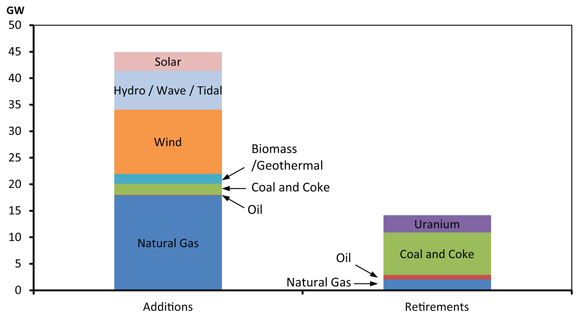
- The chart below shows additions and retirements of generating capacity over the projection period. The majority of additions to capacity are natural gas, wind and hydro facilities, accounting for 84 per cent of the total 45 GW additions from 2014 to 2040. The remaining additions include 3.5 GW of solar, 1.8 GW of biomass/geothermal and 2 GW of coal, of which 1.3 GW is CCS. Retirements are primarily coal plant shutdowns and there are small reductions in nuclear and oil-fired generating capacity.
Capacity Additions and Retirements by 2040, Reference Case
- Between 2010 and 2014, non-hydro renewables were the fastest growing generation source in percentage terms, with an annual growth rate of 20 per cent. In 2014, Canada had close to 13 GW of wind, solar, and biomass installations, accounting for 9 per cent of total capacity. Power plants harnessing tidal, wave, and geothermal resources remain relatively uncommon but tidal facilities are planned in Nova Scotia. Most wind power capacity is installed in Ontario, Quebec, and Alberta; while the majority of solar capacity is in Ontario.
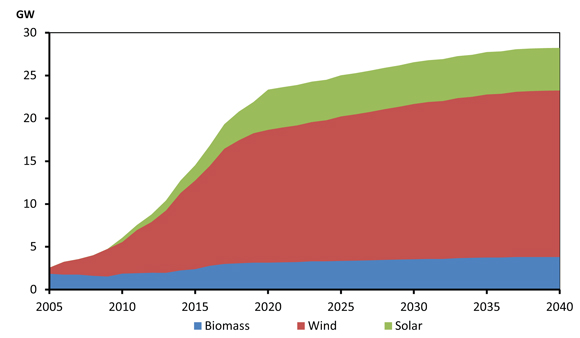
- Over the projection period, wind contributes the most to non-hydro renewable capacity growth. Total installed wind power capacity increases two-fold over the projection period, reaching 19 GW in 2040. The largest capacity additions occur in Quebec, Ontario, Alberta and Saskatchewan. The share of wind generation increases from over two per cent of total electricity generation in 2014 to close to five per cent by 2040. Solar capacity grows from 1.4 GW, or one per cent of total capacity in 2014, to 4.9 GW, or close to three per cent of total capacity in 2040. Although solar capacity is expected to increase throughout Canada, the majority of additions occur in Ontario.
- Non-hydro renewables account for 16 per cent of capacity in 2040, but they generate approximately eight per cent of total electricity. This is because wind and solar facilities have lower capacity utilization factors than hydro, nuclear, or natural gas plants due to the intermittency of wind and sunshine.
Non-hydro Renewable Capacity, Reference Case
- Date modified: