ARCHIVED – Executive Summary
This page has been archived on the Web
Information identified as archived is provided for reference, research or recordkeeping purposes. It is not subject to the Government of Canada Web Standards and has not been altered or updated since it was archived. Please contact us to request a format other than those available.
The National Energy Board’s (NEB) Energy Futures series explores how possible energy pathways might unfold for Canadians over the long term. The report employs economic and energy models to make projections based on a certain set of assumptions given what we know today about technology, energy and climate policies, human behaviour, and the structure of the economy. Readers of this analysis should consider the projections as a baseline to support ongoing discussions of Canada’s energy future. This analysis is not a prediction of what will take place, nor does it aim to show how specific goals, such as Canada’s climate targets, will be achieved.
Canada’s Energy Future 2018: Supply and Demand Projections to 2040 (EF2018) considers four different Cases:
- The Reference Case is based on a current economic outlook, a moderate view of energy prices and technological improvements, and climate and energy policies announced at the time of analysis.
- The High and Low Price Cases consider the impact of uncertain commodity prices on the Canadian energy system.
- The Technology Case pushes past the policy and technology boundaries specific to the Reference Case and includes greater global climate policy action and low carbon technology adoption. It provides one potential view of what a faster transition enabled by stronger long-term carbon policy, faster uptake of technologies such as electric vehicles, and lower cost of renewables would mean for Canada’s energy future.
Figure ES.1 Overview of Cases in Energy Futures 2018
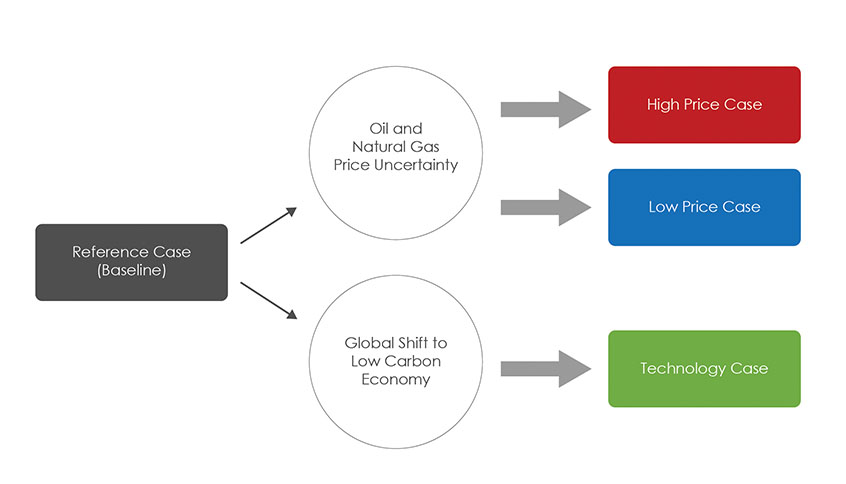
Description
This graph shows the break down between the Reference, High Price, Low Price, and Technology Cases in Energy Futures 2018. The Reference Case is the baseline scenario. The Low and High Price Cases advance on the Reference Case by accounting for oil and natural gas price uncertainty. The Technology Case advances on the reference case by incorporating the impacts of a global shift to a low carbon economy.
Key Findings (EF2018)
Key Finding 1: Canada’s energy demand growth is slowing, while sources to meet these demands are becoming less carbon intensive.
In the baseline Reference Case projection, energy use grows slowly, and by 2040 is 5% higher than current levels. Canadians use more natural gas and renewables, and less coal and oil refined petroluempetroleum products. On the supply side, Canada’s green electricity mix becomes even greener and crude oil and natural gas production grow from current levels. However, Canada’s energy future is not predetermined, and EF2018’s alternate cases explore how markets, policies, technologies, and innovation can alter these baseline trends.

Key Finding 2: In a scenario with greater adoption of new energy technologies, Canadians use over 15% less total energy and nearly 30% less fossil fuels by 2040.
The EF2018 Technology Case explores what a global shift in the implementation of various innovative technologies and related policy assumptions might mean for Canada. Non-emitting sources and energy technologies get cheaper, improvements to equipment and buildings reduce energy requirements, and markets and infrastructure adapt to these changing trends. By 2040, energy efficiency, new technologies, and fuel switching reduces combine to reduce Canadian energy use by nearly 20over 15% from current levels. The fossil fuel portion of the fuel mix that declines even faster, and is nearly 30% lower than current levels by 2040, as the relative share of non-emitting energy grows.

Key Finding 3: Energy use and economic growth continue to decouple.
In both the Reference and Technology Cases, gross domestic product (GDP) and population grow faster than energy demand, leading to reductions in energy intensity, measured in terms of total energy use per dollar of GDP and per capita. In the Reference Case, energy use per dollar of GDP is nearly 30% lower than current levels by 2040, while energy use per person is nearly 15% lower than current levels by 2040. This represents a moderate increase in the pace of decoupling compared to historical trends, and is related to a variety of factors including energy efficiency improvements, policies and regulation, and economic structural change.
In the Technology Case, these trends depart significantly from history. As the globe shifts towards a lower carbon future and other countries act on climate change in a similar fashion, economic growth in Canada is able to remain comparable to the Reference Case. Because energy use decreases in this case, energy intensity trends decline even further. By 2040, GDP energy intensity is nearly half the current levels, and energy use per capita is reduced by a third.

Key Finding 4: Canada’s energy mix continues to diversify, and its already low-emitting electricity mix adds more renewables.
As emerging forms such as wind and solar increase, traditional forms of energy have limited growth or decline. In the Reference Case, wind capacity doubles and solar capacity nearly triples over the projection period. In the Technology Case, installed capacity of non-hydro renewables reaches over 50 gigawatts (GW) by 2040, 48% higher than the Reference Case. By 2040, the share of non-emitting electricity generation increases to nearly 84% in the Reference Case and 90% in the Technology Case, compared to approximately 80% currently.

Key Finding 5: Canadian oil and natural gas production increases in the Reference Case. Price and technology trends will be key factors influencing Canadian production in the future.
Even though domestic use of oil products and natural gas grows slowly or declines, Canada has potential to increase energy production. In the Reference Case, oil and gas prices are sufficient for oil production to increase 58% by 2040, and gas production to increase by 33%.
This production growth depends on two key assumptions. First, EF2018 assumes that elevated price discounts for Canadian crude oil and natural gas benchmarks continue in the short to medium term, as production continues to outpace infrastructure capacity additions. Second, EF2018 assumes that export markets will be found to purchase the growing production that is surplus to Canadian needs. The High and Low Price Cases show the potential impact of long-term lower or higher prices, which create a large range around future production trends. The Technology Case assumes lower global fossil fuel demand, lower prices, and highlights the potential for improved technology to reduce emissions and help production remain competitive in this changing environment.
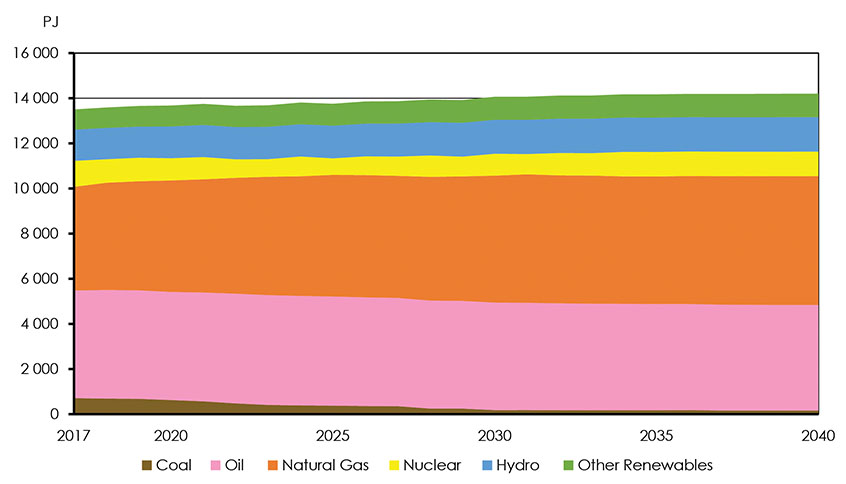
Key Finding 1 Description
This chart shows total Canadian energy use by fuel type, in the Reference Case. Coal use decreases from 713 PJ in 2017 to 166 PJ by 2040. Oil use decreases from 4770 PJ in 2017 to 4675 J in 2040. Natural Gas use increases from 4591 PJ in 2017 to 5709 PJ by 2040. Electricity use generated from hydro increases from 1380 PJ in 2017 to 1528 PJ by 2040. Electricity use generated from nuclear decreases from 1154 PJ in 2017 to 1087 PJ by 2040. Energy uses from other renewable sources increases from 894 PJ in 2017 to 1037 PJ by 2040. Total energy use increases from 13502 PJ in 2017 to 14201 PJ by 2040.
Key Finding 2 Description
This chart shows Canadian total energy demand by fuel type, in the Reference and Technology Cases. Coal demand was 1292 PJ in 2005 and 713 PJ in 2017. By 2040, coal demand falls to 166 PJ in the Reference Case, and 108 PJ in the Technology Case. Oil demand was 4766 PJ in 2005 and 4770 PJ in 2017. By 2040, oil demand falls to 4673 PJ in the Reference Case, and 3606 PJ in the Technology Case. Natural Gas demand was 3560 PJ in 2005 and 4593 PJ in 2017. By 2040, natural gas demand increases to 5683 PJ in the Reference Case, and falls to 3340 PJ in the Technology Case. Energy demand from renewable and non-emitting sources was 3176 PJ in 2005 and 3426 PJ in 2017. By 2040, energy demand from renewable and non-emitting increases to 3653 PJ in the Reference Case, and 4119 PJ in the Technology Case.
Key Finding 3 Description
This chart shows energy intensity trends in the Reference and Technology Cases as a percent of 2017 levels. Energy use per dollar of GDP declines from 100 in 2017 to 70.5 by 2040 in the Reference Case, and 55.5 in the Technology Case. Energy use per capita declines from 100 in 2017 to 87.3 by 2040 in the Reference Case and 68.8 in the Technology Case.
Key Finding 4 Description
This chart shows non-hydro renewable capacity in the Reference and Technology Cases. In the Reference Case, solar capacity increases from 2.8 GW in 2017 to 6.1 GW by 2040, wind capacity increases from 12.7 GW in 2017 to 24.3 GW by 2040, and Biomass capacity increases from 2.8 GW in 2017 to 3.3 GW by 2040. Total non-hydro renewable capacity increases from 18.3 GW in 2017 to 33.8 GW by 2040 in the Reference Case. Total non-hydro renewable capacity increases from 18.3 GW in 2017 to 50.1 GW by 2040 in the Technology Case.
Key Finding 5 Description
This chart shows crude oil and natural gas production by case, from 2017 to 2040. Crude oil production was 4.4 MMb/d in 2017. By 2040, this increases to 9.1 MMb/d in the High Price Case, 6.9 MMb/d in the Reference Case, 5.8 MMb/d in the Technology Case, and decreases to 3.8 MMb/d in the Low Price Case. Natural Gas production was 15.6 Bcf/d in 2017. By 2040, this increases to 26.9 Bcf/d in the High Price Case, and 20.9 Bcf/d in the Reference Case. Production decreases to 14.1 Bcf/d in the Technology Case, and 12.5 Bcf/d in the Low Price Case, by 2040.
- Date modified: