ARCHIVED – Canada’s Energy Future 2019 Supplement: Conventional, Tight, and Shale Oil Production
This page has been archived on the Web
Information identified as archived is provided for reference, research or recordkeeping purposes. It is not subject to the Government of Canada Web Standards and has not been altered or updated since it was archived. Please contact us to request a format other than those available.
Canada’s Energy Future 2019 Supplement: Conventional, Tight, and Shale Oil Production [PDF 259 KB]
Report Data and Figures [EXCEL 3402 KB]
Conventional, Tight, and Shale Oil Production Projection – Canada

Description:
This chart shows the production of conventional, tight and shale oil along with an average of WCS and CLS oil prices. British Columbia production grows slightly from 42 Mb/d in 2000 to 45 Mb/d in 2040. Alberta production decreases from 748 Mb/d in 2000 to 698 Mb/d in 2040. Saskatchewan production grows significantly from 416 Mb/d in 2000 to 834 Mb/d in 2040. Manitoba production grows from 11 Mb/d in 2000 to 22 Mb/d in 2040. Newfoundland production decreases from 144 Mb/d in 2000 to 107 Mb/d in 2040. The remaining provinces decrease from 29 Mb/d in 2000 to 5 Mb/d in 2040. The average WCS and CLS price increases from C$40/bbl in 2000 to C$138/bbl in 2040.
Production declines in the short-term given contined low prices, then increases in the long term as oil prices rise. Alberta and Saskatchewan continue to be the largest producers of oil outside of oil sands.
Newfoundland Offshore Oil Production

Description:
This chart shows production from offshore Newfoundland and Labrador. Production increases from 144 Mb/d in 2000 to 368 Mb/d in 2007. Production then declines for the remainder of the projection, reaching 107 Mb/d by 2040.
Thermal and EOR Oil Production

Description:
This chart shows the amount of production attributable to thermal and EOR project types. The largest is Saskatchewan thermal which grows from 71 Mb/d in 2010 to 110 Mb/d in 2040. Saskatchewan Midale EOR decreases from 9 Mb/d in 2010 to 4 Mb/d in 2040. Saskatchewan Weyburn EOR decreases from 34 Mb/d in 2010 to 17 Mb/d in 2040. Zama in Alberta decreases from 0.3 Mb/d in 2010 to 0.1 Mb/d in 2040.
Western Canada Focus
Western Canada - Light - Heavy

Description:
This chart shows the amount of oil produced in western Canada by both heavy and light. Heavy oil production increases from 632 Mb/d in 2000 to 837 Mb/d in 2040 while light increases from 585 M/d in 2000 to 763 Mb/d in 2040.
Western Canada - Conventional - Tight - Shale

Description:
This chart shows the amount of conventional, tight and shale oil produced in western Canada. Conventional oil production decreases from 1 217 Mb/d in 2000 to 747 Mb/d in 2040. Tight oil begins production in 2005 and increases to 767 Mb/d by 2040. Shale oil begins production in 2012 and increases to 86 Mb/d in 2040
British Columbia

Description:
This chart shows the production of conventional light and tight-light oil in British Columbia. Conventional light oil production declines from 42 Mb/d in 2000 to 2 Mb/d in 2040. Tight-light production begins in 2011 and increases steadily reaching 43 Mb/d in 2040.
Alberta
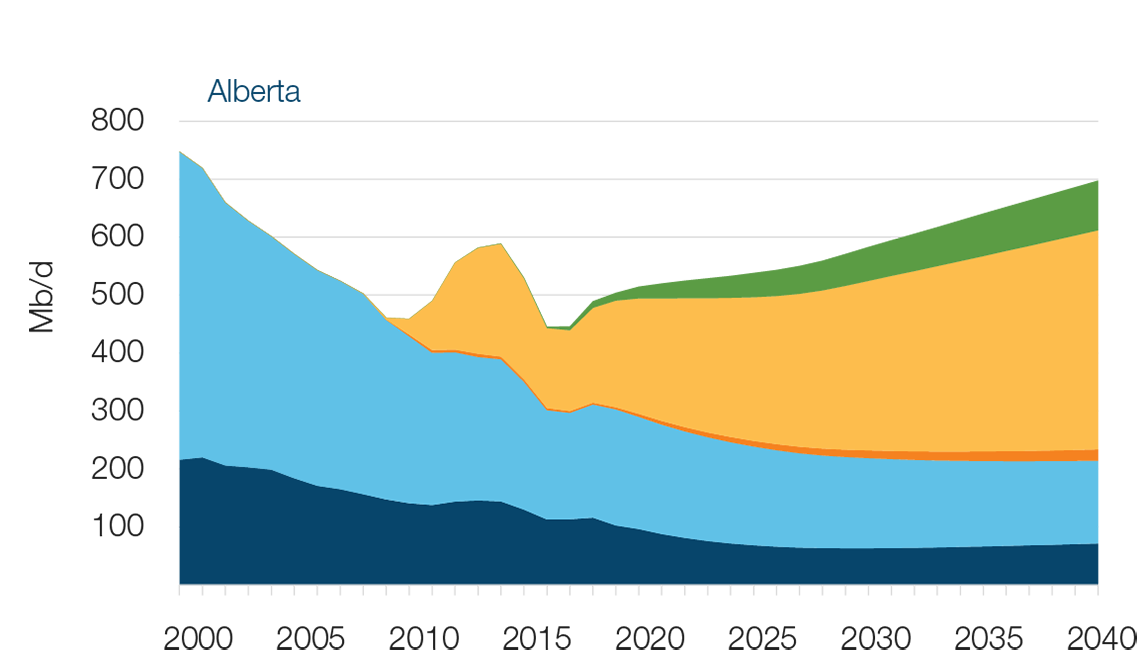
Description:
This chart shows the production of conventional heavy and light, tight heavy and light, and shale oil in Alberta. Conventional heavy oil production decreases from 216 Mb/d in 2000 to 71 Mb/d in 2040 while conventional light also decreases, from 532 Mb/d in 2000 to 143 Mb/d in 2040. Tight-heavy oil production begins in 2009 and increases to 19 Mb/d in 2040 while tight-light begins in 2008 and increases to 378 Mb/d in 2040. Shale oil production begins in 2012 and increases to 86 Mb/d in 2040.
Saskatchewan

Description:
This chart shows the production of conventional heavy, tight heavy and tight light oil in Saskatchewan. Conventional-heavy oil production grows from 416 Mb/d in 2000 to 526 Mb/d in 2040. Tight-heavy oil production begins in 2006 and increases to 220 Mb/d by 2040. Tight light oil production begins in 2005 and increases to 88 Mb/d in 2040.
Manitoba

Description:
This chart shows conventional light and tight-light oil production in Manitoba. Conventional light oil production decreases from 11 Mb/d in 2000 to 4 Mb/d in 2040. Tight-light oil production begins in 2005 and increases to 18 Mb/d by 2040.

| 2010 | 2015 | 2020 | 2025 | 2030 | 2035 | 2040 | |
|---|---|---|---|---|---|---|---|
| Conventional, Tight, and Shale Oil Produciton, thousand b/d | 1 225 | 1 267 | 1 419 | 1 554 | 1 583 | 1 662 | 1 711 |
| British Columbia | 22 | 21 | 25 | 32 | 35 | 40 | 45 |
| Alberta | 459 | 530 | 514 | 538 | 583 | 641 | 698 |
| Saskatchewan | 422 | 486 | 571 | 659 | 718 | 782 | 834 |
| Manitoba | 30 | 46 | 32 | 24 | 22 | 22 | 22 |
| Newfoundland | 276 | 172 | 267 | 292 | 218 | 172 | 107 |
| Other | 17 | 11 | 9 | 8 | 7 | 6 | 5 |
| WCS and CLS Average Oil Price, C$/barrel | $76 | $56 | $80 | $95 | $110 | $122 | $138 |
| Oil Wells | 5 236 | 2 618 | 2 845 | 3 441 | 3 981 | 4 245 | 4 498 |
- Date modified: