ARCHIVED – The Unconventional Gas Resources of Mississippian-Devonian Shales in the Liard Basin of British Columbia, the Northwest Territories, and Yukon - Energy Briefing Note
This page has been archived on the Web
Information identified as archived is provided for reference, research or recordkeeping purposes. It is not subject to the Government of Canada Web Standards and has not been altered or updated since it was archived. Please contact us to request a format other than those available.
March 2016


Permission to Reproduce
Materials may be reproduced for personal, educational and/or non-profit activities, in part or in whole and by any means, without charge or further permission from the National Energy Board, British Columbia Oil and Gas Commission, British Columbia Ministry of Natural Gas Development, Northwest Territories Geological Survey, or Yukon Geological Survey provided that due diligence is exercised in ensuring the accuracy of the information reproduced; that the National Energy Board, British Columbia Oil and Gas Commission, British Columbia Ministry of Natural Gas Development, Northwest Territories Geological Survey, and Yukon Geological Survey are identified as the source institutions; and that the reproduction is not represented as an official version of the information reproduced, nor as having been made in affiliation with, or with the endorsement of the National Energy Board, British Columbia Oil and Gas Commission, British Columbia Ministry of Natural Gas Development, Northwest Territories Geological Survey, or Yukon Geological Survey.
For permission to reproduce the information in this publication for commercial redistribution, please e-mail: info@cer-rec.gc.ca
ISSN 1917-506X
978-0-660-04668-6
Copies are available on request from:
National Energy Board
The Publications Office
National Energy Board
444 Seventh Avenue S.W.
Calgary, Alberta, T2P 0X8
E-Mail: publications@cer-rec.gc.ca
Fax: (403) 292-5576
Phone: (403) 299-3561
1-800-899-1265
The Northwest Territories Geological Survey
NWT Open File 2016-05
P.O. Box 1320
4601-B 52 Avenue
Yellowknife, NWT
X1A 2L9
Tel: 867-767-9211 ext.63469
Kumari_Karunaratne@gov.nt.ca
The Yukon Geological Survey
YGS Miscellaneous Report 14
PO Box 2703 (K-102)
Whitehorse, YT
Y1A 2C6
Tel: 867.455.2800
geology@gov.yk.ca
British Columbia Oil and Gas Commission
PO Box 9331
Stn Prov Govt
Victoria, B.C.
V8W 9N3
Tel: 250-419-4400
OGC.Communications@bcogc.ca
British Columbia Ministry of Natural Gas Development
Victoria, British Columbia;
Tel: 250-952-0377
Fil.Ferri@gov.bc.ca
Table of Contents
Foreword
National Energy Board
The National Energy Board (NEB or Board) is an independent federal regulator established to promote safety and security, environmental protection and economic efficiency in the Canadian public interest within the mandate set by Parliament for the regulation of pipelines, energy development and trade. The Board's main responsibilities include regulating the construction, operation and abandonment of pipelines that cross international borders or provincial/territorial boundaries, as well as the associated pipeline tolls and tariffs, the construction and operation of international power lines and designated interprovincial power lines; and imports of natural gas and exports of crude oil, natural gas liquids (NGL), natural gas, refined petroleum products and electricity.
For oil and natural gas exports, the Board’s role is to evaluate whether the oil and natural gas proposed to be exported is surplus to reasonably foreseeable Canadian requirements, having regard to the trends in the discovery of oil or gas in Canada.
If a party wishes to rely on material from this report in any regulatory proceeding before the Board, it may submit the material, just as it may submit any public document. Under these circumstances, the submitting party in effect adopts the material and could be required to answer questions pertaining to its content.
This report does not provide an indication about whether any application will be approved or not. The Board will decide on specific applications based on the material in evidence before it at that time.
The Northwest Territories Geological Survey
The Northwest Territories Geological Survey (NTGS) is a division of the Department of Industry, Tourism and Investment, Government of the Northwest Territories. The NTGS advances geoscience knowledge about the Northwest Territories for the benefit of northerners and all Canadians. The NTGS does this through the delivery of geoscience research, analysis of mineral and petroleum resources, and by offering excellence in digital data management. The NTGS regularly collaborates with its partners and other organizations in support of modern geoscience research, public awareness and education, and informed decision making.
The Yukon Geological Survey
The mandate of the Yukon Geological Survey (YGS) is to be the authority and provider of choice for the geoscience and related technical information required to enable stewardship and sustainable development of the Territory’s energy, mineral, and land resources. The YGS generates and compiles information on Yukon’s geology, mineral and petroleum resources; works in partnership with other branches of Yukon Government to distribute geoscience maps and publications to exploration companies, First Nations and the public; and through studies such as this assessment, contributes information required to make informed resource management decisions.
British Columbia Oil and Gas Commission
The BC Oil and Gas Commission (Commission) is the provincial regulatory agency with responsibilities for regulating oil and gas activities in British Columbia, including exploration, development, pipeline transportation and reclamation.
The Commission’s core services include reviewing and assessing applications for industry activity, consulting with First Nations, cooperating with partner agencies, and ensuring industry complies with provincial legislation and all regulatory requirements. The public interest is protected by ensuring public safety, respecting those affected by oil and gas activities, conserving the environment, and ensuring equitable participation in production.
Responding to the complex and often competing economic, environmental and social priorities driving the oil and gas industry, the Commission maintains a modern regulatory framework and proactively looks for innovative solutions for continued safe and sustainable oil and gas development in the province. In accordance with its mandate, the Commission strives to deliver fair and timely decisions on proposed projects, balancing firm oversight of operational safety and First Nations’ rights.
The Commission liaises with other provincial and federal government agencies in ensuring effective delivery of government policy, improved regulatory climate and cohesive application of existing regulations. It is of key importance for the Commission to stay fully apprised of the latest technological breakthroughs, and independent world-wide scientific research pertinent to the industry.
British Columbia Ministry of Natural Gas Development
The role of the British Columbia Ministry of Natural Gas Development is to guide the responsible development and ensure maximum economic benefits to British Columbians from the province’s natural gas resources and the province’s next new major industrial sector - that of liquefied natural gas (LNG).
Through teamwork and positive working relationships with its clients, the Ministry facilitates B.C.’s thriving, safe, environmentally responsible and competitive natural gas sector to create jobs and economic growth. In developing natural gas policies, legislation and guidelines, the Ministry consults with other ministries and levels of government, energy companies, First Nations, communities, environmental and industry organizations, and the public.
A key component of the Ministry’s mandate is to develop tenure, royalty and regulatory policy for British Columbia’s natural gas industry, thereby promoting the effective and environmentally responsible management of the province’s natural gas resources.
The Ministry provides a range of natural gas related services, including the issuance of Crown subsurface resource rights, royalty programs, public geoscience and policies to address potential future resource opportunities, including unconventional natural gas resource development. The Ministry’s LNG Secretariat reports to the new Cabinet Working Group on Liquefied Natural Gas, which will advise on budgets, structure, mandate and service plan goals.
Executive Summary
The marketable, unconventional gas potential of the Exshaw and Patry shales of the Liard Basin’s Besa River Formation have been evaluated in a joint assessment by the National Energy Board, the British Columbia Oil and Gas Commission, the British Columbia Ministry of Natural Gas Development, the Northwest Territories Geological Survey, and the Yukon Geological Survey. The thick and geographically extensive Exshaw and Patry shales are expected to contain 6.20 trillion m³ (219 trillion cubic feet) of marketable natural gas.Footnote 1
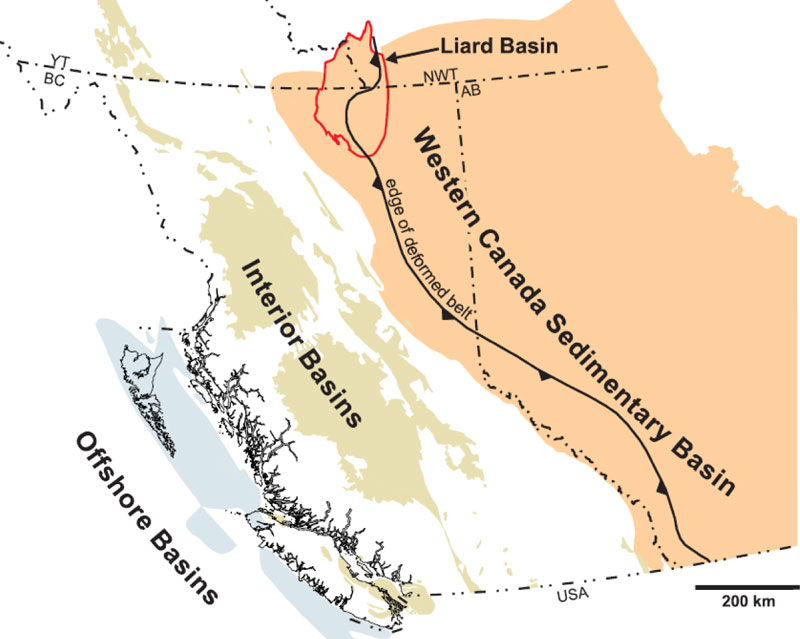
Figure 1. Location of the Liard Basin within the Western Canada Sedimentary Basin. The eastern boundary of the Liard Basin largely coincides with the Bovie Fault (see Figure 2). Modified from Ferri et al. (2015)
Introduction
The Liard Basin is a lightly drilled region at about 60 °N that straddles the boundaries of the Northwest Territories (NWT), Yukon, and the province of British Columbia (B.C.) (Figure 1). It is located at the far northwest corner of the Western Canada Sedimentary Basin (WCSB), Canada’s major oil and gas producing area. The Liard Basin’s unconventionalFootnote 2 potential had not been assessed in detail before this study.
While the Liard Basin’s conventional potential was not assessed in this study, conventional natural gas has been produced in the Liard Basin from the Beaver River Field of B.C. since the late 1960s, the Pointed Mountain Field and other gas fields of the NWT since the early 1970s, and the Kotaneelee Field of Yukon since the late 1970s. Conventional gas has also been produced from B.C.’s Maxhamish Field since the late 1990s. Thus, there are already gas pipelines in the Liard Basin in all three jurisdictions.
Geological Description
Sediments were deposited in the Liard Basin from the Cambrian period to the end of the Cretaceous period (from 540 million years (Ma) ago to 65 Ma ago). The central and eastern portions of the Liard Basin are relatively undeformed by faults where the Liard Basin’s western and northwestern regions were faulted when the Rocky Mountains and Mackenzie Mountains were uplifted. The Liard Basin’s eastern edge is defined by the Bovie Fault, separating it from the Horn River Basin. However, the two basins share many of the same shales, including the Exshaw and Horn River shales (Figure 2) .Footnote 3 The Horn River Basin’s shale gas potential was assessed in 2011.Footnote 4
Figure 2. Stratigraphic architecture of the Besa River Formation and related units (not to scale). Vertical displacement on the Bovie Fault is not shown.

The Middle Devonian to Middle Mississippian Besa River Formation (deposited from 385 Ma to 335 Ma ago) is a succession of shales in the Liard Basin (Figure 2). The Besa River Formation ranges from 300 metres (m) thick to the west to over 2 000 m thick near the Bovie Fault to the east.
Straddling the Devonian-Mississippian boundary in the Besa River Formation is the Exshaw shale, which is prospective for shale gas. For most of the Liard Basin, the Patry shale underlies the Exshaw and is also prospective.Footnote 5 The Exshaw-Patry shale is in the early stages of exploration and, since 2009, has produced 356.6 million m³ (12.6 billion cubic feet (Bcf)) of gas from two vertical wells and two horizontal wells in B.C.
The Exshaw-Patry shale’s “net pay”Footnote 6 ranges from 20 m thick at the Liard Basin’s eastern edge to over 200 m in the basin’s centre. The Exhsaw-Patry shale is less than 1 kilometre (km) deep at the basin’s northern edge to over 4 km deep in the centre of the basin. Total organic carbon (TOC) contents are typically 1.5 to 6 per cent. Silica contents are from 65 to 85 per cent. Porosity is between 4 and 9 per cent and is highest in organic-rich horizons.
The Exshaw-Patry shale is also exceptional amongst North American shale gas plays because it is typically very deep, very rich in silica (the reservoir is very brittle and prone to cracking when hydraulic fracturing is applied), and it is 100 per cent over-pressured where tested.Footnote 7
Deeper in the Besa River Formation are the Horn River shales (Figure 2), which extend into the Liard Basin from the Horn River Basin to the east, where they produce shale gas. Little information is available about these deeper shales in the Liard Basin of B.C., while more information is available in NWT and Yukon where the Horn River shales are shallower. In NWT and Yukon, these shales range from less than 1 km deep at the northern edge of the Liard Basin to more than 4 km deep at the territories’ southern borders. The net pay ranges from 40 m at its northern edge to almost 300 m around the Pointed Mountain gas field of NWT.
Methods
The original gas-in-place (OGIP) in the Liard Basin was assessed using methods similar to those in a 2013 study that examined B.C.’s Montney FormationFootnote 8, where map grids of geological data were connected to free gas and adsorbed gas equationsFootnote 9 to determine how gas volumes geographically vary. However, unlike the Montney study, this study’s marketable gas was determined from the estimated ultimate recovery (EUR) from a hypothetical, index shale gas well as based on an analysis of Liard Basin production data. The EUR from an index tractFootnote 10 was then determined from the number of wells assumed to fully develop it. The EURs of other tracts in the Liard Basin were then determined by calibrating them to the index tract through their net pays, TOCs (a proxy for porosity, gas saturation, and adsorbed gas), pressures, and areas.
Statistical distributions were applied to some variables in assessment equations and then Monte Carlo simulations were used to estimate low, expected, and high values.Footnote 11 A surface loss to convert raw OGIP to dry OGIP through the removal of gas impuritiesFootnote 12, as well as to convert raw EURs to marketable EURs through the removal of impurities and some fuel gas for gas processing, was also applied.
In B.C. and Yukon, areas of the Liard Basin within the Rocky Mountains, Mackenzie Mountains, and Franklin Mountains were excluded from the assessment except for the outer fringes of the Rocky Mountain and Franklin Mountain foothills, which were considered a deformed play area. In NWT, the Franklin Mountains (including the Liard Range) were included in the assessment and formed NWT’s deformed area. Elsewhere, the Liard Basin was considered undeformed.
To simulate reservoir risks in deformed areas where pressures can be naturally drained by faults, a reservoir risk factor was applied to OGIP. Meanwhile, technical risk factors were applied to EURs in deformed areas because of risks associated with drilling such that less gas was considered recoverable in the deformed areas of B.C. and Yukon, while no gas was considered recoverable in the deformed area of NWT except for the Pointed Mountain gas field. It was also assumed that development would not occur where net pay is less than 30 m and where depths are shallower than 1 500 m, because flow rates would be too low to justify drilling.
The Exshaw-Patry shale was assessed in B.C., NWT, and Yukon for both OGIP and marketable gas because prolonged production from the interval indicates that gas is present and recoverable. In contrast, the Horn River shales in the Liard Basin were assessed solely for OGIP and only in NWT and Yukon because the Horn River shales are considered to be too deep in B.C. to be developed. Although a preliminary well test in NWT indicates gas is present in the Horn River shales, there is not enough production data to indicate that gas is recoverable in any meaningful amount. No volumes of natural gas liquids were assessed because gas analyses indicate that the gas is dry.
More details of the assessment’s methods are available in Appendix B.
Assessment results and observations
The ultimate potential for marketable, unconventional gas in the Liard Basin is estimated to be very large (Table 1), with expected volumes of 6 196 billion m³ (219 Tcf).Footnote 13 Uncertainty in the estimates is reflected by the spread between estimated low and high values in Table 1.Footnote 14 Most of the marketable gas is located in B.C., though NWT’s and Yukon’s potentials are still large.
For perspective, the Montney Formation’s marketable potential has been estimated to be 12 719 billion m³ (449 Tcf) and the Horn River Basin’s 2 198 billion m³ (78 Tcf). Further, total Canadian natural gas demand in 2014 was 89.4 billion m³ (3.2 Tcf)Footnote 15, making the Liard Basin gas resource equivalent to 68 years of Canada’s 2014 consumption. However, it is too early to know whether the Liard Basin will significantly contribute to Canadian gas production in the near term because gas prices are expected to remain low for the next several years, deterring development. Although additional in-place gas potential is found in the Horn River shales of the Liard Basin (Table 2), it is uncertain whether any is technically recoverable.
By combining this marketable gas estimate with prior assessments, including assessments of conventional natural gas, the total ultimate potential in the WCSB is estimated to be 29 773 billion m³ (1 051 Tcf) (Table 3). Of this, 24 140 billion m³ (853 Tcf) remains after cumulative production to year-end 2014 is subtracted. This total is expected to evolve, likely growing over time as additional potential is estimated in unassessed shales, such as the Duvernay Formation of Alberta. Overall, Canada has a very large remaining natural gas resource base in the WCSB to serve its markets well into the future.
Table 1. Ultimate potential for Liard Basin unconventional gas in the Exshaw-Patry shale
| Shale | Play Area | Volume units | Gas in Place (dry) | Marketable Gas | ||||
|---|---|---|---|---|---|---|---|---|
| Low | Expected | High | Low | Expected | High | |||
| Exshaw-Patry | Total | Billion m³ | 20 041 | 34 365 | 54 475 | 2 419 | 6 196 | 12 019 |
| Tcf | 708 | 1 213 | 1 924 | 86 | 219 | 425 | ||
| British Columbia | Billion m³ | 14 070 | 24 027 | 37 863 | 1 839 | 4 731 | 9 139 | |
| Tcf | 497 | 848 | 1 337 | 65 | 167 | 323 | ||
| Northwest Territories | Billion m³ | 5 206 | 9 017 | 14 541 | 497 | 1 250 | 2 481 | |
| Tcf | 184 | 318 | 514 | 18 | 44 | 88 | ||
| Yukon | Billion m³ | 765 | 1 321 | 2 071 | 83 | 215 | 399 | |
| Tcf | 27 | 47 | 73 | 3 | 8 | 14 | ||
Table 2. Unconventional gas resources of the Liard Basin’s Horn River shales
| Shale | Play Area | Volume units | Gas in Place (dry) | Marketable Gas | ||||
|---|---|---|---|---|---|---|---|---|
| Low | Expected | High | Low | Expected | High | |||
| Horn River | Northwest Territories | Billion m³ | 2 584 | 5 293 | 8 983 | - | - | - |
| Tcf | 91 | 187 | 317 | - | - | - | ||
| Yukon | Billion m³ | 318 | 593 | 1 024 | - | - | - | |
| Tcf | 11 | 21 | 36 | - | - | - | ||
Table 3. Estimate of ultimate potential for marketable natural gas in the WCSB
| Area | Gas Type | 109 m³ | Tcf | ||||
|---|---|---|---|---|---|---|---|
| Ultimate Potential |
Cumulative Production |
Remaining | Ultimate Potential |
Cumulative Production |
Remaining | ||
| Alberta | Conventional | 6 276 | 4 622 | 6 798 | 221.5 | 163.2 | 240.1 |
| Unconventional | 5 143 | 181.6 | |||||
| CBM | 101 | 3.6 | |||||
| Montney | 5 042 | 178.0 | |||||
| Alberta Total | 11 419 | 403.1 | |||||
| British Columbia | Conventional | 1 462 | 769 | 15 495 | 51.6 | 27.2 | 547.2 |
| Unconventional | 14 854 | 524.6 | |||||
| Horn River | 2 198 | 77.6 | |||||
| Montney | 7 677 | 271.0 | |||||
| Cordova | 248 | 8.8 | |||||
| Liard | 4 731 | 167.1 | |||||
| British Columbia Total | 16 316 | 576.2 | |||||
| Saskatchewan | Conventional | 297 | 223 | 75 | 10.5 | 7.9 | 2.6 |
| Unconventional | 82 | 2.9 | |||||
| Bakken | 82 | 2.9 | |||||
| Saskatchewan Total | 379 | 13.4 | |||||
| Southern NWT | Conventional | 132 | 14 | 1 368 | 4.7 | 0.5 | 48.3 |
| Unconventional | 1 250 | 44.1 | |||||
| Liard | 1 250 | 44.1 | |||||
| Southern NWT Total | 1 382 | 48.8 | |||||
| Southern Yukon | Conventional | 61 | 6 | 271 | 2.2 | 0.2 | 9.6 |
| Unconventional | 215 | 7.6 | |||||
| Liard | 215 | 7.6 | |||||
| Southern Yukon Total | 276 | 9.8 | |||||
| WCSB Total | 29 773 | 5 633 | 24 140 | 1051 | 199 | 853 | |
| Notes: - Determined from reliable, published assessments by federal and provincial agencies. - For this table, “unconventional” is defined as natural gas produced from coal (CBM) or by the application of multi-stage hydraulic fracturing to horizontal wells. - The ultimate potential for natural gas should be considered an estimate that will evolve over time. Additional unconventional potential may be found in unassessed shales, such as the Duvernay Shale of Alberta. |
|||||||
Appendix A - List of Acronyms
| B.C. | British Columbia |
| Bcf | Billion cubic feet |
| EUR | Estimated ultimate recovery |
| Ma | Million years |
| NTS | National topographic system |
| NWT | Northwest Territories |
| OGIP | Original gas in place |
| Tcf | Trillion cubic feet |
| TOC | Total organic carbon |
| WCSB | Western Canada Sedimentary Basin |
Appendix B - Methodology
Key Assumptions
- The gas resource was considered to be a resource play in all three jurisdictions, where gas is pervasively distributed through the geologically defined area. Thus, the chance of success at discovering gas with a well is 100 per cent.
- Well EURs are based on existing technology, current trends in development, and limited production. No detailed analyses of technological advancements have been performed for this study. Recoveries and levels of development could be different in the future as technology advances and the play matures.
- No study has been undertaken to determine the economics for marketable resources and the determination of what can be developed is based on the view of the project agencies.
Stratigraphy and Study Area
Stratigraphic Intervals and Net Pay Determination
The Exshaw-Patry interval (Figure A.1) was treated as a single, radioactive shale whose net pay could be identified using a 10 ohm-m or higher reading on resistivity logs. Net pay in NWT’s and Yukon’s Horn River shales (Figure A.1) was identified with the same criteria.
Play Areas
The assessed area of the Liard Basin was defined on its eastern side by the Bovie Fault and on its western side by the western limit of Cretaceous outcrop. Thus, in B.C. and Yukon, the assessment area excludes the Rocky Mountains, Mackenzie Mountains, and Franklin Mountains except for the outer fringes of the Rocky Mountain and Franklin Mountain foothills, which form a deformed play area. Meanwhile, the Franklin Mountains (including the Liard Range) of NWT are included in the assessment and considered NWT’s deformed area. Elsewhere, the Liard Basin is considered undeformed (Figure A.2). Areas north of 60 ° 40’ N in the NWT were excluded because of proximity to Nahanni National Park.
Tracts
The Liard Basin map area was broken into a grid of small tracts to accommodate the way the reservoir locally changes. In B.C., a tract was considered a grid-spacing unit: four units arranged two-by-two in the National Topographic System (NTS) geographic-grid system, about 2.6 km² in size. In NWT and Yukon, a tract was considered a section in the NTS-quad geographic-grid system, about 3.2 km² in size.
Figure A.1. Cross-section across study area with Exshaw top as datum

Figure A.2. Assessment play areas with wells used in the assessment

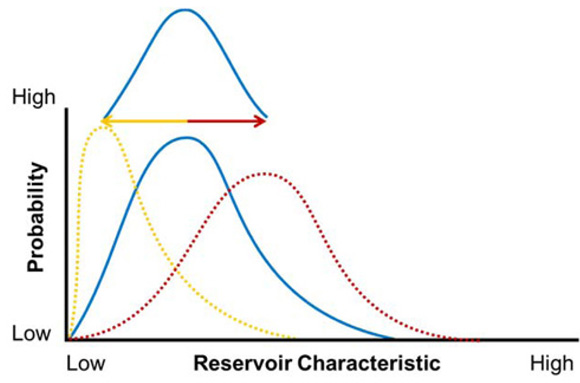
Figure A.3. One distribution applied upon another to create a “distribution of distributions”
Free and Adsorbed Gas Estimations for Estimation of in-place resources
The assessment was done on a map-grid basis where, for each tract, Monte Carlo simulations were run on a series of mathematical equations to determine volumes and the results summed to determine the total. The assessment was also integrated at two levels, i) a tract-by-tract scale, and ii) a basin scale (Figure A.3), to try to incorporate local changes with uncertainties inherent at the basin level.
See Table A.1 for the equation variables based on mapped data as well as the variables (both mapped and unmapped) that had distributions attached to them for the Monte Carlo simulations. Because the evaluated horizons were treated as single units, variables like porosity, water saturation, and TOC were applied as averages over the entire rock section.
To reduce potential skewing of distributions modeled on mapped data, “soft” maximums or minimums for distribution curves were used (i.e., the distribution’s low and high values wandered based on a percentage of the mapped “most likely” values) rather than “hard” maximum or minimums, as long as the soft values did not exceed or fall below impossible values, such as creating negative numbers. For distributions modeled on net pay, TOC, and depth, the uncertainties - the ranges between a tract’s low and high values - were reduced as determined by the number of data points in the surrounding NTS block in the case of B.C. and the surrounding grid area in NWT and Yukon.
In-place Resources Equations
Natural gas in the Liard Basin is present in two main forms: free and adsorbed. Therefore, the total raw natural gas stored in the Liard Basin prior to production can be determined by using the following basic equation at each grid point:
RGIPtotal = RGIPfree + RGIPadsorbed
Where RGIPtotal is the total raw gas in place, RGIPfree is the free raw gas in place, and RGIPadsorbed is the raw adsorbed gas in place.
Free raw gas in place was estimated with a volumetric equation (all variables for all equations described in Table A.1):
| RGIPfree = | A × H × Φ × Sg × | (D × PG × Tx) (Ps × Tf × Z) |
× RRF |
Adsorbed raw gas in place was estimated with the equation:
| RGIPadsorbed = | A × H × ρb × (1 - Φ) × | (TOC × LtO × D × PG) ____________________ (PL × D × PG) |
× RRF |
Raw gas in place was converted to dry gas in place (DGIPtotal) with the equation:
DGIPtotal = RGIPtotal × (1 - SLGIP)
Reservoir Risk Factors
In B.C. and Yukon, a reservoir risk factor of 0.9 was applied to OGIP in deformed areas (i.e., OGIP would be reduced by 10 per cent) because, while there is some faulting that could drain gas pressures, these areas are largely in a relatively undeformed, broad syncline between the Franklin Mountains and the structurally controlled Beaver River and Kotaneelee gas fields. In NWT, a reservoir risk factor of 0.5 was applied to OGIP in deformed areas (except for the Pointed Mountain gas field, where 0.75 was used) because these are largely within the heavily faulted Franklin Mountains.
Table A.1. Variable descriptions and model inputs used for assessment - Exshaw-Patry succession
| Variable | Symbol | Map (Y/N) |
Prob. Dist. (Y/N) |
Tract Model Inputs (low / most likely/ high) |
Basin Model Inputs (low / most likely / high) |
Correlations and notes | Data Source |
|---|---|---|---|---|---|---|---|
| Area (m²) | A | Y | N | Map-grid spacing | - | - | - |
| Depth (m) | D | Y | Y | Based on map | - | - | Well logs |
| Net Pay (m) | H | Y | Y | 0.9/1/1.1 tract multiplier | 0.95/1/1.05 map multiplier | - | Well logs/core |
| Porosity (%) | ϕ | N | Y | ϕ =0.6707*TOC%+ (2.0/4.272/6.5) |
0.5/ 1/ 1.5 map multiplier | Correlated w/ TOC% | Core |
| Gas Saturation (%) | Sg | N | Y | Sg=3.7588*TOC%+ (37.0/56.659/76.0) |
0.5/1/1.5 map multiplier | Correlated w/ TOC% map | Core |
| Pressure Gradient (kPa/m) | PG | N | Y | 13/20/27 | 0.5/1/1.5 map multiplier | - | Production tests |
| Surface Pressure (kPa) | Ps | N | N | 101.3 | - | Standard conditions | - |
| Reservoir Temperature (°K) | TF | N | N | Based on thermal gradients: map in NWT 40°K/km YT 35-45°K/km BC |
- | Correlated w/ depth map | Well logs |
| Surface Temperature (°K) |
Ts | N | N | 273 | - | Surface temperature | - |
| Gas Compressibility | Z | N | N | BC: 1.4 NWT & Yukon: 1.25 |
- | - | Gas analyses; best estimate |
| Surface Loss - GIP and EUR (fraction) | SLGIP SLEUR |
N | N | SLGIP = 0.08 SLEUR = 0.12 |
- | - | Gas analyses; best estimate |
| Rock Matrix Density (ton/m³) | ρb | N | N | 2.6 | - | - | Core |
| Total Organic Content - TOC (%) | TOC | Y (N in NWT) | Y | BC and Yukon: 0.5/1/1.5 tract multiplier NWT: 2.2/3.75/5.3 |
0.6/1/1.4 map multiplier | - | Core/well logs |
| Langmuir Volume to Organic Content Ratio (m³/ton/TOC%) | LtO | N | Y | 0.1667/0.5/1.5 | 0.5/1/1.5 map multiplier | - | Adsorbed gas tests on core samples |
| Langmuir Pressure (kPa) | PL | N | Y | 5 000/8247/11 500 | 0.5/1/1.5 map multiplier | - | Adsorbed gas tests on core samples |
| Reservoir Risk Factor (fraction) | RRF | N | N | Undeformed: 1 Deformed: BC/Yukon 0.9; NWT 0.5 (Pointed Mountain 0.75) |
- | - | Best estimate |
Table A.2. Variable descriptions and model inputs used for assessment - Horn River succession
| Variable | Symbol | Map (Y/N) |
Prob. Dist. (Y/N) |
Tract Model Inputs (low / most likely/ high) |
Basin Model Inputs (low / most likely / high) |
Correlations and notes | Data Source |
|---|---|---|---|---|---|---|---|
| Area (m²) | A | Y | N | Map-grid spacing | - | - | - |
| Depth (m) | D | Y | Y | Based on map | - | - | Well logs |
| Net Pay (m) | H | Y | Y | 0.9/1/1.1 tract multiplier | 0.95/1/1.05 map multiplier | - | Well logs/core |
| Porosity (%) | ϕ | N | Y | ϕ =0.506*TOC%+ (0.75/3.55/6.25) |
0.5/ 1/ 1.5 map multiplier | Correlated w/ TOC% | Horn River Basin core |
| Gas Saturation (%) | Sg | N | Y | Sg=2.8277*TOC%+ (43.94/68.47/93) |
0.5/1/1.5 map multiplier | Correlated w/ TOC% | Horn River Basin core |
| Pressure Gradient (kPa/m) | PG | N | Y | 10/16/22 | 0.5/1/1.5 map multiplier | - | Horn River Basin production |
| Surface Pressure (kPa) | Ps | N | N | 101.3 | - | Standard conditions | - |
| Reservoir Temperature (°K) | TF | N | N | Based on thermal gradients: map in NWT 40°K/km Yukon |
- | Correlated w/ depth map | Well logs |
| Surface Temperature (°K) |
Ts | N | N | 273 | - | Surface temperature | - |
| Gas Compressibility | Z | N | N | 1.25 | - | - | Gas analyses |
| Surface Loss - GIP (fraction) | SLGIP | N | N | SLGIP = 0.15 | - | - | Gas analyses; best estimate |
| Rock Matrix Density (ton/m³) | ρb | N | N | 2.6 | - | - | Horn River Basin core |
| Total Organic Content - TOC (%) | TOC | Y (N in NWT) | Y | Yukon: 0.5/1/1.5 tract multiplier NWT: 0.5/2.5/5 |
0.6/1/1.4 map multiplier | - | Core / cuttings/ well logs |
| Langmuir Volume to Organic Content Ratio (m³/ton/TOC%) | LtO | N | Y | 0.1/0.335./0.5 | 0.5/1/1.5 multiplier | - | Horn River Basin core |
| Langmuir Pressure (kPa) | PL | N | Y | 2 000/5 650/8 650 | 0.5/1/1.5 multiplier | - | Horn River Basin core |
| Reservoir Risk Factor (fraction) | RRF | N | N | Undeformed: 1 Deformed: B.C./Yukon 0.9; NWT 0.5 (Pointed Mountain 0.75) |
- | - | Best estimate |
Estimated Exshaw-Patry EURs
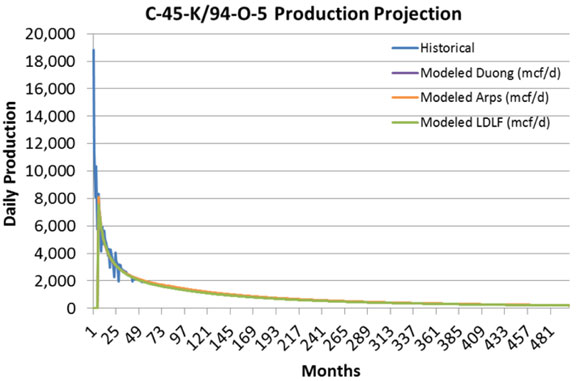
B.C.’s c-45-K/94-O-5 horizontal well, which was completed in the Exshaw-Patry interval, was used to create an index well so that recoveries from an index tract could be determined. c-45-K’s production was modeled using an early stage of transient flow for the first 84 months of post-peak production followed by a later stage of boundary-dominated flow, which is not yet observed in the historical data in any of the shale-gas wells in the Liard Basin (data up to 53 months). A cutoff of 50 years was applied to cumulative production to determine its EUR. Results were compared to nearby wells to determine whether the estimated EUR was reasonable. A well-quality factor was also applied, which caused the well’s EUR to range higher or lower to simulate uncertainty in EUR results (zero as a minimum to twice as high as a maximum).
Transient flow
The modeled transient flow excluded the first month of post-peak data, which did not fit the main trend of historical data on a log-log plot of production vs. time. This early deviation was likely because the well was still flowing back hydraulic fracturing fluids or production was in early bilinear flow before transitioning to linear flow.
Transient flow was modeled by regressing the historical data using the Duong modelFootnote 16, the Arps hyperbolic modelFootnote 17 (where Excel’s Solver is used to determine initial production, initial decline, and the Arps b exponent), and a Long Duration Linear Flow model (which, for this study, is a linear regression of the historical data on a log-log plot of production versus time) (Figure 4).
Boundary-dominated flow
Boundary-dominated flow at the end of transient flow for each of the three, above models was estimated using Arps hyperbolic flow. Because boundary-dominated flow is not yet observed in well data, initial production was assumed to be production at the end of each model’s transient flow, the annual initial decline to be 0.1, and the Arps b exponent to be 0.5.
Indexing Tracts
The index well (Figure A.4 and Table A.3) was created by: 1) averaging the three estimated EURs; 2) calculating the EUR per 1 km of stimulated horizontal leg in c-45-K; and 3) creating a hypothetical well that would fit along the long axis of a tract while keeping “buffer” space at the well’s toe and heel to avoid interfering with any wells that would be drilled in adjacent tracts.
The index tract (Table A.3) was created by estimating the amount of recoverable gas in a tract local to c-45-K as based on the number of index wells expected be drilled in it. Some reservoir characteristics at c-45-K - net pay, pressure, and TOC (which is assumed to be a proxy for porosity, gas saturation, and adsorbed gas concentrations) - were extracted from local tracts to create an index for how production in other tracts might behave where reservoir conditions differ. Because tract sizes change in the NTS grid based on how units and sections change sizes in north-south directions, the index tract was also indexed to tract size at c-45-K to reflect that well spacing or development plans could change where tracts are bigger or smaller.
Figure A.4. Modeled production curves for c-45-K
Limits to Development
For the EUR analysis, it was assumed that no development would occur in areas shallower than 1 500 m or where the net pay was less than 30 m, because flow rates would likely be too low to justify drilling. In B.C. and Yukon, a technical risk factor of 0.75 was applied to tract EURs in deformed areas to simulate technical risks that recoveries may face. In NWT, the Franklin Mountains are heavily faulted and this technical risk factor was decreased to zero except in the Pointed Mountain gas field where it was decreased to 0.6 (i.e., outside the Pointed Mountain gas field, the NWT’s deformed area was assumed to have gas in place in the Exshaw-Patry interval, but no recoveries).
Raw Gas to Marketable Gas Conversion
Similar to OGIP estimates, raw EUR was converted to marketable EUR by applying a surface loss based on expected impurity contents as well as fuel needed for gas processing.
Table A.3. Index well expected parameters
| c-45-K | Index Well | Index DSU | ||||||
|---|---|---|---|---|---|---|---|---|
| Raw EUR (Bcf) |
Stim Hz length (km) |
Raw EUR/ km |
Stim Hz length (km) |
Index well Raw EUR (Bcf) |
Wells/ DSU |
Raw EUR/ DSU (Bcf) |
Surface Loss (fraction) |
Sales EUR/ DSU (Bcf) |
| 15.8 | 0.85 | 18.6 | 1.75 | 32.55 | 1.5 | 48.56 | 0.12 | 42.73 |
- Date modified: