Market Snapshot: Year in Review 2017
Release date: 2017-12-21

No large-scale liquefied natural gas (LNG) export facilities in Canada
The United States (U.S.) has the only two existing LNG export terminals in North America. Only one is currently in operation, the Sabine Pass terminal which can export up to 2.4 billion cubic feet a day (Bcf/d). The U.S. also has five facilities currently under construction. Canada currently has no pre-existing liquefaction facilities and none under construction.
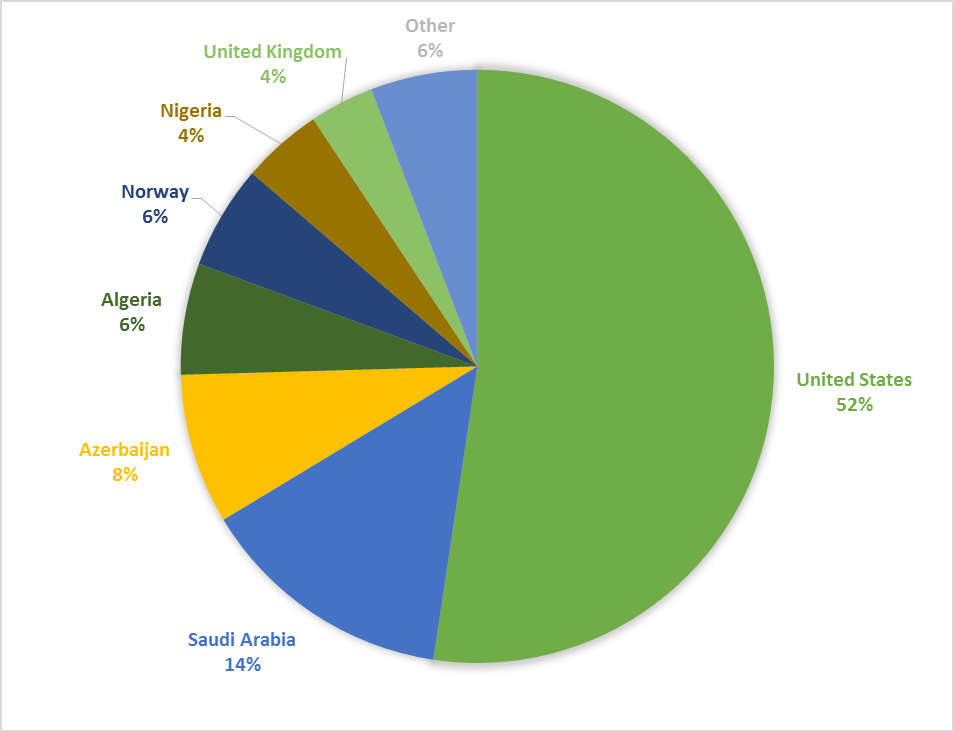
Canada continues to import crude oil from around the world
In the first 9 months of 2017, Canada imported an average of 719 thousand barrels per day of crude oil (114 thousand cubic metres). This is less than last year, when an average of 772 barrels per day were imported over the first 9 months. These 2017 imports reflected a lower share from the U.S., Algeria, and Nigeria compared to 2016, and a higher share from Saudi Arabia, Azerbaijan, Norway, and the United Kingdom.
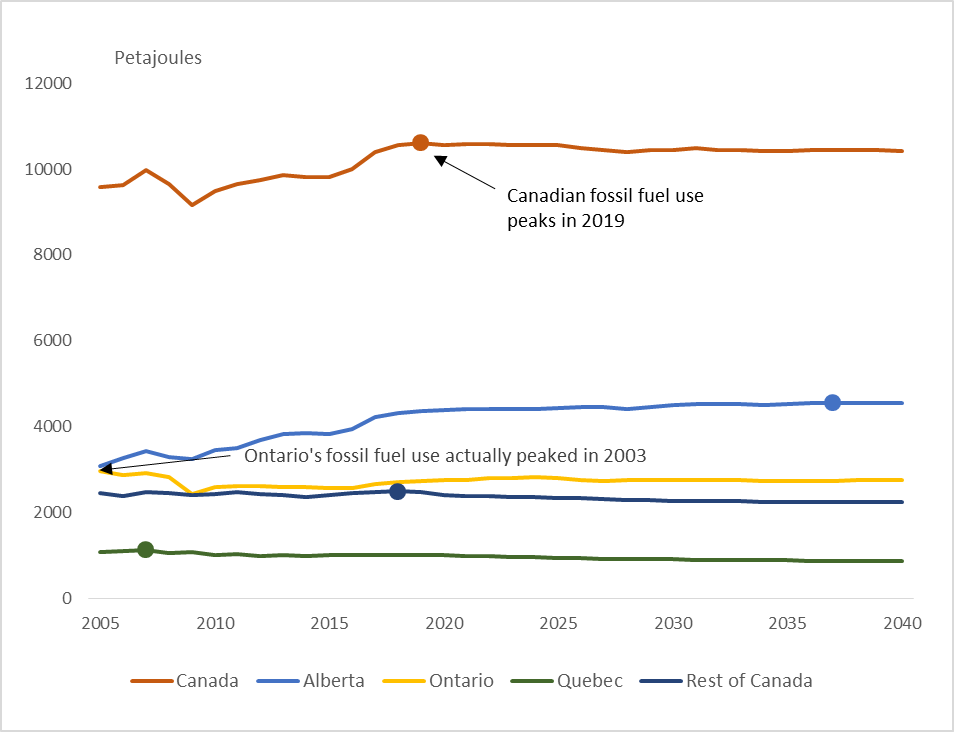
Canada’s fossil fuel use projected to peak in 2019
Fossil fuel use includes the use of coal, oil products, and natural gas. Fossil fuel use trends differ across regions, although Ontario and Quebec fossil fuel use peaked prior to the 2008-2009 recession, Alberta’s fossil fuel use continues to increase for most of the Reference Case projection. The increase is due to various factors, such as a 2.1 million barrel per day increase in crude oil production from 2016 to 2040, and economic growth higher than the Canadian average. Alberta demand eventually flattens out in the longer term, reaching its maximum in 2037.
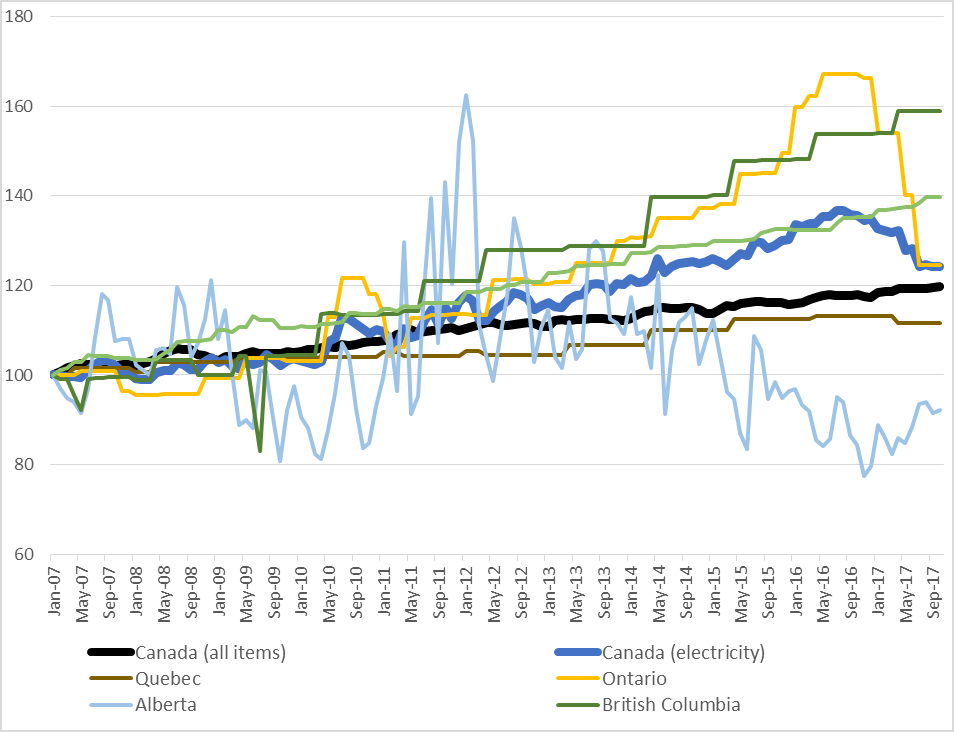
Canadian electricity prices generally increase faster than inflation
The electricity component of the consumer price index (CPI) generally increases faster than overall inflation, but trends vary among provinces. Starting in January 2017, the electricity component began decreasing significantly in Ontario as it passed legislation to rebate the provincial portion of the harmonized sales tax on electricity bills.
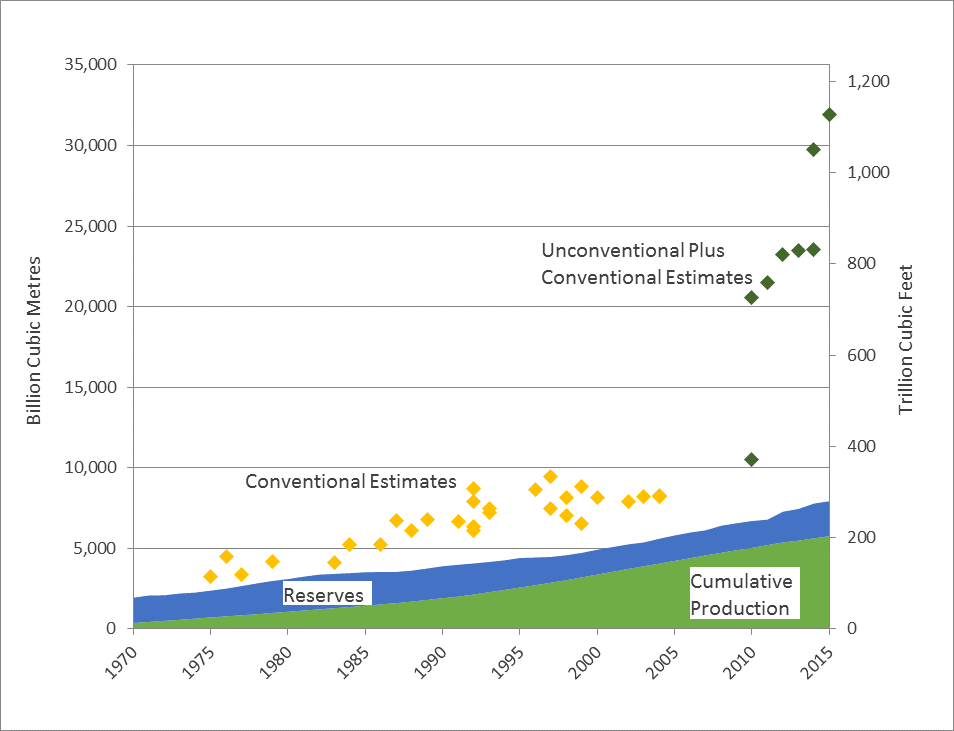
Published estimates of ultimately recoverable natural gas in western Canada have grown rapidly
Estimates of western Canada's total potential for recoverable gas have soared over the past ten years because new technology has unlocked natural gas previously thought to be unrecoverable.
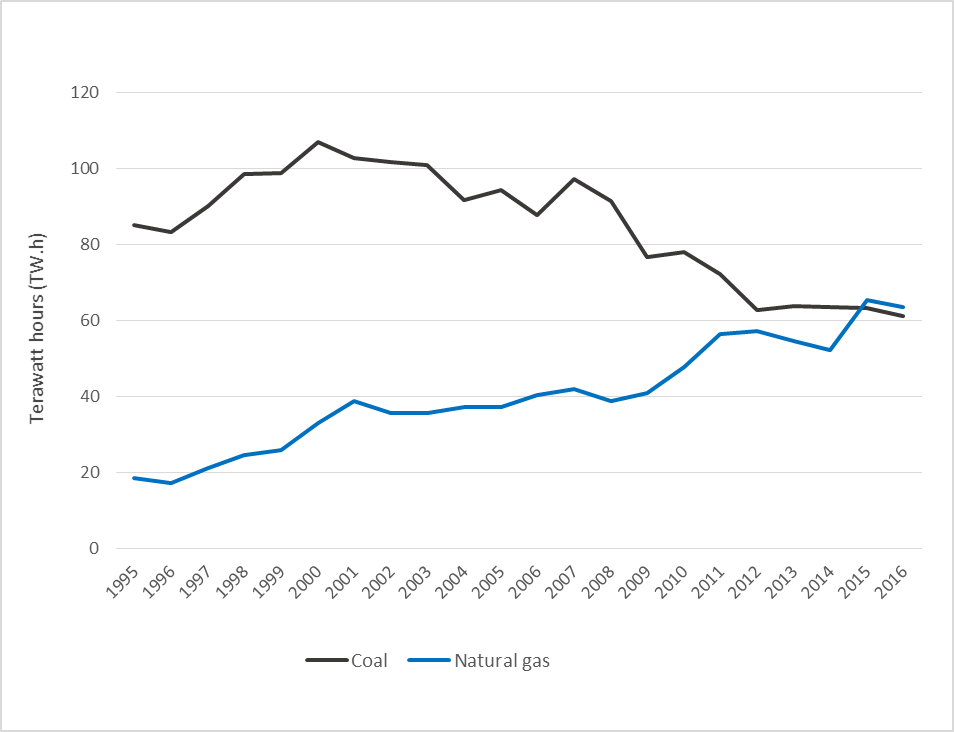
Coal and natural gas use in Canadian electricity generation moving in opposite directions
Over the last 20 years, the use of coal in electricity generation has fallen significantly, from 15% of total generation in 1996 to 11% by 2015. The use of natural gas in electricity generation has increased significantly, from 3% of total generation in 1996 to 11% by 2015.
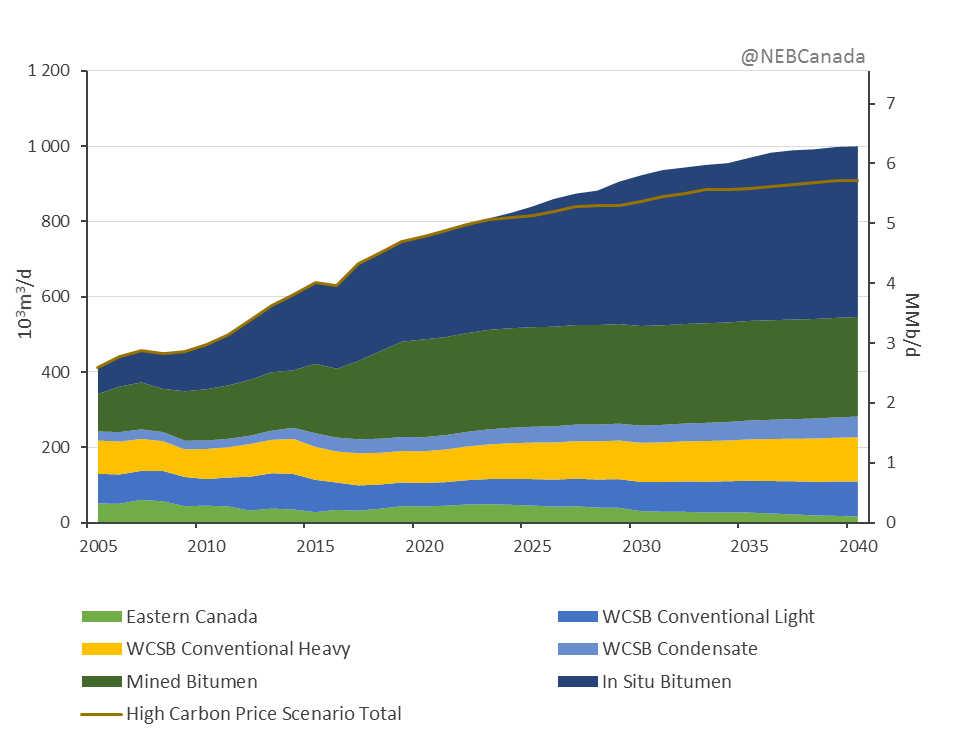
Canada’s oil production is projected to continue growing even with climate action policies
By 2040, Canadian crude oil production is projected to reach 1 000 thousand cubic metres per day (10³m³/d) or 6.3 million barrels per day (MMb/d). This is 59% higher than 2016 levels of 631 10³m³/d (4.0 MMb/d). Even when a high carbon price is assumed to be in place, total oil production still reaches 908 10³m³/d (5.7 MMb/d) by 2040.
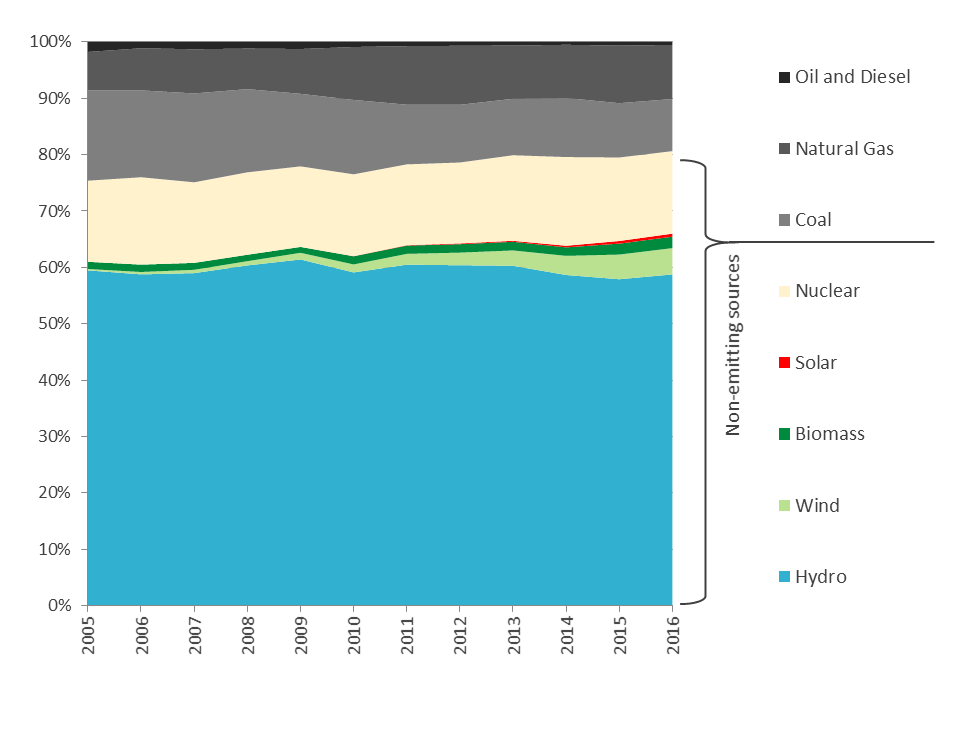
Share of Canadian electricity generation which doesn’t emit greenhouse gases is still growing
Canada's share of non-greenhouse gas (GHG) emitting electricity generation was over 80% in 2016 and continues to grow. This graph considers electricity generated from hydro, tidal, wind, biomass, solar, nuclear, and coal with carbon capture and storage to be non-emitting. Biomass is considered non-emitting because the carbon released from burning biofuels was previously absorbed out of the atmosphere by plants.
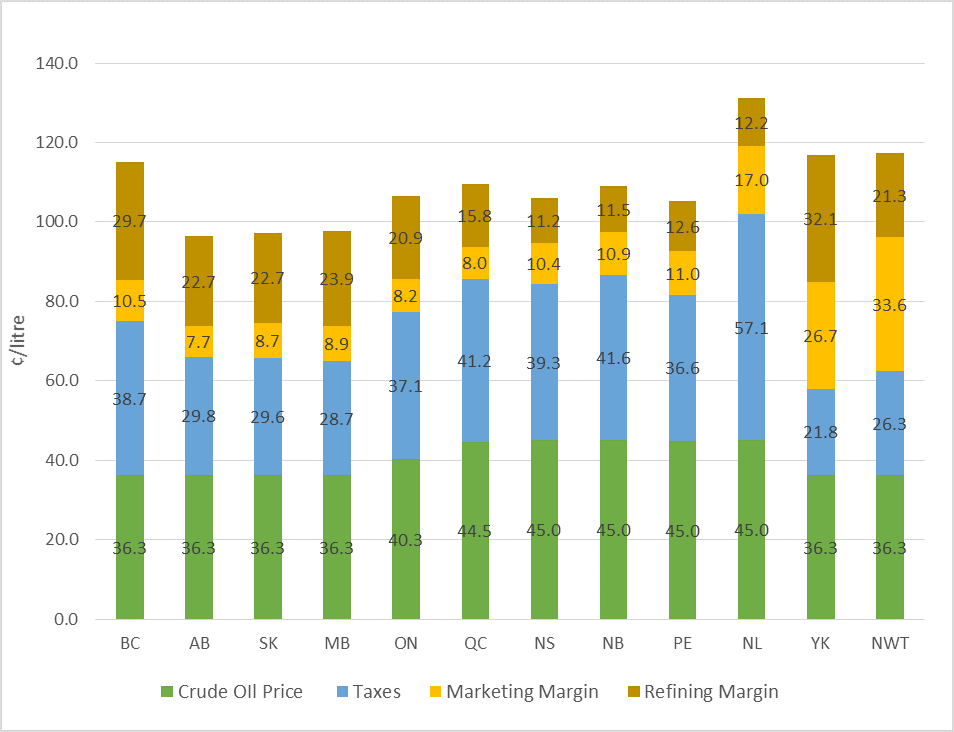
Retail gasoline prices vary across Canada
The retail price of gasoline is comprised of four components: the crude oil price, the refining margin, the marketing margin, and taxes (federal, provincial or territorial, and municipal). Retail gasoline prices vary across Canada because of differences in these components.
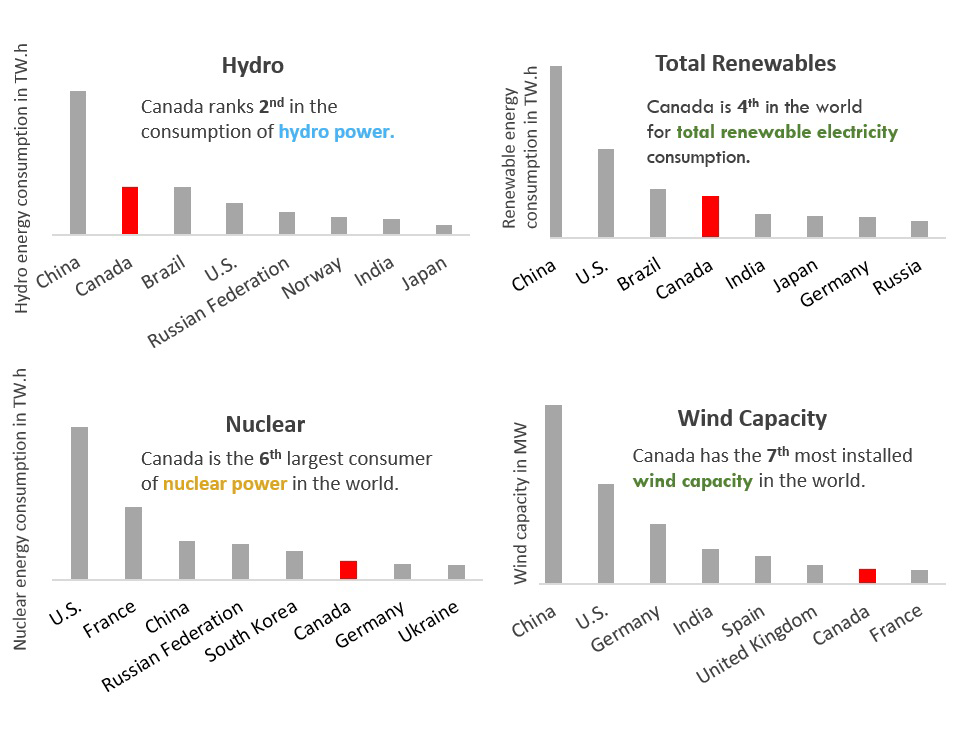
Canada is a global leader in renewable electricity
Canada is among the top countries in the word in terms of renewable and non-emitting electricity production.
Figure 1 Source and Description
Source: NEB
Description: This graph shows LNG export facilities in North America that are existing or under construction. There are two existing liquefaction facilities in the U.S., Kenai LNG in Alaska which is not currently operational, and Sabine Pass on the Gulf of Mexico which has two operational trains. The U.S. also has 5 facilities under construction along the east coast and Gulf of Mexico. Canada has no LNG export facilities existing or under construction.
Figure 2 Source and Description
Source: Canadian International Merchandise Trade Database
Description: This pie chart shows Canadian imports of crude oil by country from January to September 2017. Of crude oil imports, 52% came from the U.S., followed by Saudi Arabia (14%), Azerbaijan (8%), Norway and Algeria (6%), Nigeria and the United Kingdom (4%), with the remaining 6% coming from other countries (from most to least imports: Colombia, Angola, Kazakhstan, Russia, Ivory Coast, Mexico, Oman, Trinidad and Tobago, Ghana, France, Kuwait, Brazil and Estonia).
Figure 3 Source and Description
Source: Canada’s Energy Future 2017: Energy Supply and Demand Projections to 2040
Description: This chart shows EF2017 Reference Case fossil fuel use projections for Canada, Alberta, Ontario, Quebec, and the rest of Canada combined. Canadian fossil fuel use continues to increase in the projection until peaking in 2019. Alberta fossil fuel use continues to increase in the projection to 2020, at which point growth slows with use peaking in 2037. Ontario and Quebec fossil fuel use have already peaked, and gradually decline in the long term. Fossil fuel use in the rest of Canada peaks in 2018 and gradually declines afterwards.
Figure 4 Source and Description
Source: Statistics Canada
Description: This line graph shows the electricity component of the CPI for Canada, Quebec, Ontario, Alberta, British Columbia, and a combination of other provinces and territories from January 2007 to October 2017. The combination of other provinces and territories includes Newfoundland and Labrador, Prince Edward Island, Nova Scotia, New Brunswick, Manitoba, Saskatchewan, Yukon and Northwest Territories; data for Nunavut was not available. The graph also shows the all-item CPI for Canada. All lines are indexed to equal 100 in January 2007. From January 2007 to October 2017, the all-item index increased steadily from 100 to 120. At the same time, the Canadian electricity index increased from 100 to 124, after peaking at 132 in April 2017. Quebec’s electricity index increased from 100 to 112. Ontario rose from 100 in January 2007 to reach 167 in March 2017, then dropped sharply after June 2017 to 124 in October 2017. Alberta has been very volatile, increasing to a high of 162 in January 2012, and then dropped to a range between 70 and 90 in 2016 and 2017. The Alberta index experiences monthly spikes, whereas the other indices are smoother. British Columbia increased steadily from 100 in January 2007 to 160 in October 2017. The combined series for other provinces and territories closely followed the national electricity index until late 2016 when the national index fell but the series for other provinces continued increasing to reach 140 in October 2017.
Figure 5 Source and Description
Source: NEB, and published estimates of ultimately recoverable natural gas in the WCSB from provincial governments and other government agencies and non-governmental organizations.
Description: This graph shows western Canadian cumulative gas production, remaining reserves, and estimates of the Western Canadian Sedimentary Basin's ultimate potential for natural gas production from 1980 to 2015. Cumulative production plus remaining reserves steadily grew from 38 Tcf in 1970 to 280 Tcf in 2015. Natural gas reserves have remained relatively steady between 55 and 75 Tcf. While estimates of the total gas potential of the basin steadily grew from between 146 and 185 Tcf in the early 1980s to around 300 Tcf in 2004, a significant change occurred in 2010, when unconventional resources such as shale gas and Montney tight gas were first included. The most recent estimate of western Canadian ultimate potential is over 1 100 Tcf, more than triple the estimates from prior to 2005.
Figure 6 Source and Description
Source: Statistics Canada
Description: This line graph shows the annual amount of electricity generated in Canada using natural gas and coal from 1996 to 2016. The amount generated is measured in terawatt hours (TW.h) per year. Electricity generated from coal increased between 1996 and 2000, and then declined most years from 2000 to 2016. Electricity generated from natural gas generally increased between 1996 and 2016. As a result of these trends, coal and natural gas each accounted for approximately the same amount of Canadian electricity generation in 2016 – between 65 and 66 TW.h.
Figure 7 Source and Description
Source: Canada’s Energy Future 2017: Energy Supply and Demand Projections to 2040
Description: This graph breaks down the growth in Canadian crude oil and equivalent production in the Reference and HCP cases from 2005 to 2040. Eastern Canadian production changes from .32 MMb/d in 2005 to 0.10 MMb/d in 2040 in the Reference Case. WCSB conventional light production changes from 0.50 MMb/d in 2005 to 0.58 MMb/d in 2040 in the Reference Case. WCSB conventional heavy production changes from 0.56 MMb/d in 2005 to 0.74 MMb/d in 2040 in the Reference Case. WCSB condensate production changes from 0.15 MMb/d in 2005 to 0.35 MMb/d in 2040 in the Reference Case. Mined bitumen production changes from 0.63 MMb/d in 2005 to 1.66 MMb/d in 2040 in the Reference Case. In situ bitumen production changes from 0.44 MMb/d in 2005 to 2.85 MMb/d in 2040 in the Reference Case. Total production in the Reference Case changes from 2.59 MMb/d in 2005 to 6.29 MMb/d in 2040. In the HCP Case total production changes from 2.59 MMb/d in 2005 to 5.71 MMb/d in 2040.
Figure 8 Source and Description
Source: NEB
Description: This graph shows the composition of Canada’s electricity generation between 2005 and 2016. Hydro averaged 59.6%. Wind increased from 0.2% to 4.7%. Biomass increased from 1.3% to 2.0%. Solar grew from zero to 0.5%. Coal declined from 16.1% to 9.3%. Natural gas increased from 6.8% to 9.6%. Oil and diesel declined from 1.8% to 0.5%. Coal with carbon capture and storage is too small to be visible on the graph.
Figure 9 Source and Description
Source: NRCan, NEB
Description: The graph shows a breakdown of provincial and territorial retail gasoline prices between July 2016 and June 2017. Gasoline prices are comprised of the crude oil price, refining margin, marketing margin, and taxes. In general, the largest component is the crude oil price, which was on average 40 cents per litre (¢/l). The next largest component is taxes which were on average 36 ¢/l. The refining margin and the marketing margin averaged 20 ¢/l and 14 ¢/l respectively. The highest gas price was in Newfoundland and Labrador at 131 ¢/l, with the largest component of this being taxes (57.1 ¢/l). The lowest prices were in Alberta, Saskatchewan, and Manitoba, which were around 97 ¢/l. Price data for Nunvut is unavailable.
Figure 10 Source and Description
Source: BP Statistical Review of World Energy
Description: This infographic shows Canada’s global ranking in electricity. Canada is a world leader in hydroelectricity. Canada is 2nd in generation and consumption of hydro power. Canada is 4th in the world for total renewable electricity generation and consumption. In terms of nuclear energy consumption, Canada consumes the 6th most in the world. Canada is 7th in the world for installed wind capacity.
- Date modified: