Market Snapshot: Can you guess how we generate electricity?
Release date: 2018-01-03
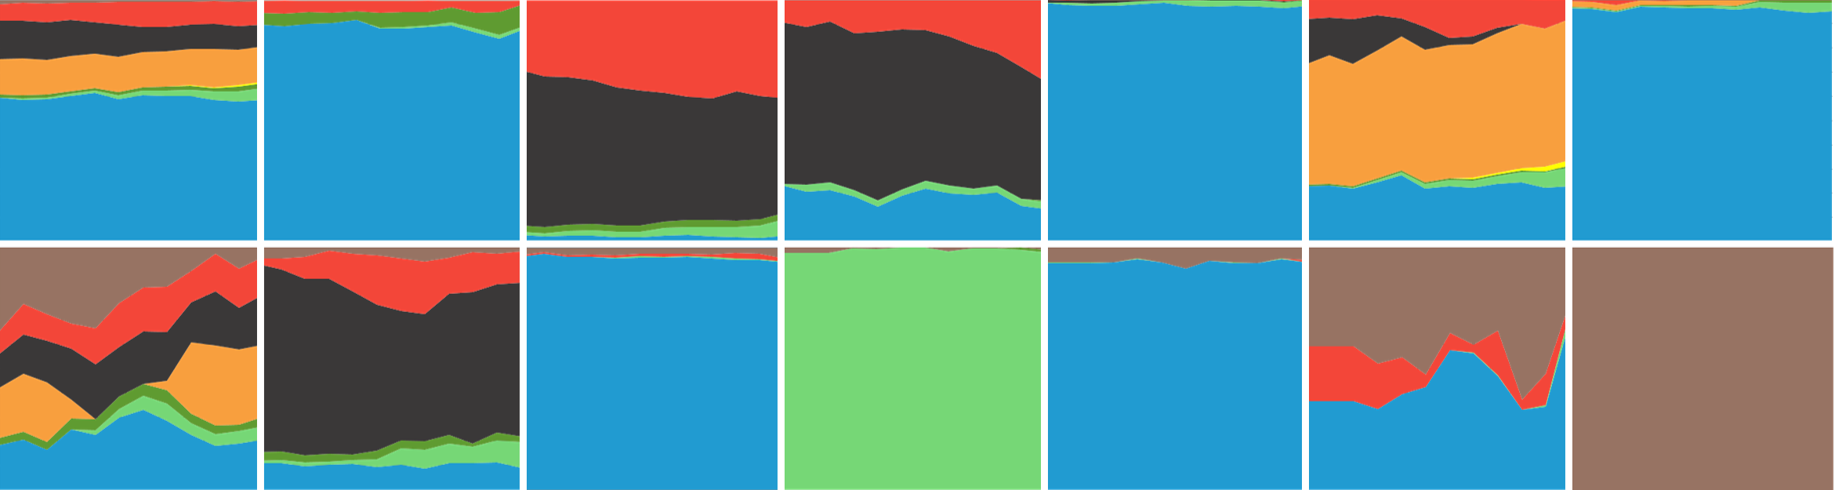
What energy sources do Canadian provinces and territories use to generate their electricity? The stacked area charts below illustrate the breakdown of electricity generation by source from 2005 to 2016. There is a chart for each province and territory. Can you guess which chart belongs to which region based on the sources of electricity generation?
For more information see Canada's Renewable Power Landscape 2017.
Which graph belongs to which province or territory?
0.
As an example, when you click the graph below you will see it is the breakdown of Canada’s total electricity generation by source from 2005 to 2016. Now can you guess for each of the provinces and territories?

Source and Description
Source: NEB
Description: This graph shows the composition of Canada’s electricity generation between 2005 and 2016. Hydro averaged 59.6%. Wind increased from 0.2% to 4.7%. Biomass increased from 1.3% to 2.0%. Solar grew from zero to 0.5%. Coal declined from 16.1% to 9.3%. Natural gas increased from 6.8% to 9.6%. Oil and diesel declined from 1.8% to 0.5%.
1.
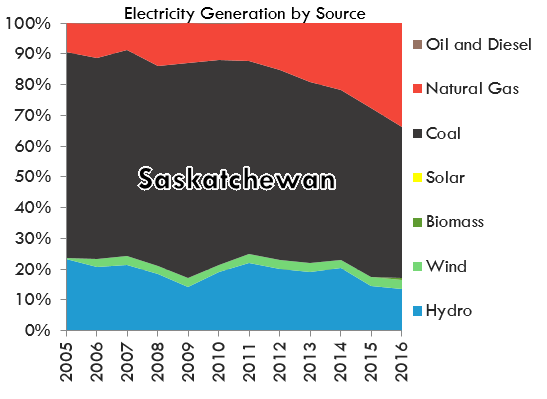
This prairie province primarily uses coal and natural gas, but also uses a significant amount of hydro.
Source and Description
Source: NEB
Description: This graph shows the composition of Saskatchewan’s electricity generation between 2005 and 2016. Hydro’s share fluctuated between 13.4% and 23.2% of generation. Wind averaged 2.7%. Coal decreased from 67.0% in 2005 to 49.3% in 2016. Natural gas’ share increased from 9.3% in 2005 to 33.7% in 2016.
2.
This province has the highest share of wind generation of any province or territory.

Source and Description
Source: NEB
Description: This graph shows the composition of PEI’s electricity generation between 2005 and 2016. Wind increased from 97.8% to 98.1% of generation. Biomass generated 0.9% in 2016. Oil and diesel fell from 2.2% to 1.0%.
3.
This is the only Maritime province to generate a majority of its electricity from coal.

Source and Description
Source: NEB
Description: This graph shows the composition of Nova Scotia’s electricity generation between 2005 and 2016. On average, hydro accounted for 10.2% of generation. Wind grew from 1.0% to 10.6%. Biomass generation averaged 3.0%. Coal fell from 77.9% to 63.7%. Natural gas fluctuated from 2.1% in 2005 to a high of 21.9% in 2012 before falling to 12.9% in 2016. Oil and diesel decreased from 4.6% to 1.6%.
4.
This territory generates the most significant share of its electricity from hydro and diesel.

Source and Description
Source: NEB
Description: This graph shows the composition of NWT’s electricity generation between 2005 and 2016. Hydro’s share fluctuated from 36.6% in 2005 to a high of 69.8% in 2016. Wind grew from zero to 3.9% from 2012 to 2016. Natural gas generally decreased from 22.5% to 3.9%, with fluctuations year to year. Oil and diesel generation averaged 43.0% from 2005 to 2016, but fell to 22.4% in 2016.
5.
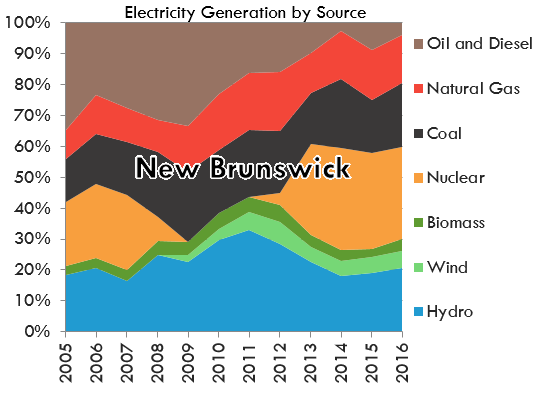
This eastern province is one of two that use nuclear power to generate electricity.
Source and Description
Source: NEB
Description: This graph shows the composition of New Brunswick’s electricity generation between 2005 and 2016. Hydro fluctuated from 18.4% in 2005, to 33.0% in 2011, then decreased to 20.6% in 2016. Wind’s share increased from zero to 5.6%. Biomass remained stable at around 4.0%. Nuclear dropped to zero between 2009 and 2011 then increased to 29.9% in 2016. Coal fluctuated from 13.9% in 2005, to an average of 21.6% between 2009 and 2011, and was 20.7% in 2016. Natural gas increased from 9.4% in 2005 to 15.5% in 2016, while oil and diesel dropped from 34.7% to 3.9% over these years.
6.
This hydro dominated province used to generate nuclear power until the end of 2012.

Source and Description
Source: NEB
Description: This graph shows the composition of Quebec’s electricity generation between 2005 and 2016. On average, hydro accounted for 95.9% of generation. Wind increased from 0.2% in 2005 to 3.6% in 2016. Biomass increased from 0.4% to 1.0%. Nuclear power dropped from 2.4% to zero in 2012. Natural gas, oil and diesel accounted for about 0.2% in 2016.
7.
This province generates most of its electricity from coal and natural gas, but also generates the most wind power in western Canada.

Source and Description
Source: NEB
Description: This graph shows the composition of Alberta’s electricity generation between 2005 and 2016. Hydro accounted for 3.4% of generation in 2005 and 2.8% in 2016. Biomass increased from 2.5% to 2.7% over that period. Wind increased from 1.1% in 2005 to 6.9% in 2016. Coal decreased from 64.3% to 47.4%. Natural gas, increased its share from 28.7% to 40.3%.
8.
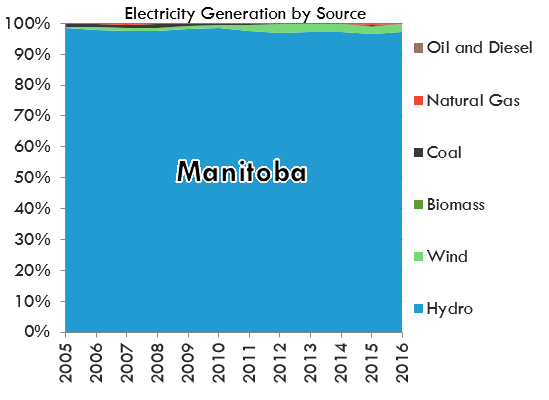
This province generates over 97% of its electricity from hydro. This is the highest share of hydro generation of any province.
Source and Description
Source: NEB
Description: This graph shows the source of Manitoba’s electricity generation between 2005 and 2016. On average, hydro has accounted for about 97.5% of generation. Wind increased from 0.1% in 2005 to 2.4% in 2016. Biomass has remained less than half a percent of generation. Coal, natural gas, oil and diesel each averaged less than half of a percent of generation, and have decreased to shares near zero in 2016.
9.
This province generates the majority of its electricity from nuclear power, and phased out coal generation in 2014.

Source and Description
Source: NEB
Description: This graph shows the composition of Ontario’s electricity generation between 2005 and 2016. On average, hydro accounted for 23.1% of generation. Wind’s share grew from zero to 7.8%, solar from zero to 2.3%, and biomass remained at 0.7%. Nuclear grew from 49.6% to 58.3% of generation. Coal decreased from 18.7% in 2005 to 0% in 2014. Natural gas peaked at 16.1% in 2011 before falling to 8.2% in 2016.
10.
This territory generates almost all its electricity from diesel.

Source and Description
Source: NEB
Description: This graph shows the composition of Nunavut’s electricity generation between 2005 and 2016. Oil and diesel accounted for almost all of generation since 2005. Nunavut’s solar generation is estimated to be less than 0.1 GW.h per year. It is too small to be visible on the graph.
11.
This eastern province generates most of its electricity from hydro. Diesel is its second largest source of electricity.

Source and Description
Source: NEB
Description: This graph shows the composition of Newfoundland and Labrador’s electricity generation between 2005 and 2016. On average, hydro accounted for 95.8% of generation. Wind and biomass generated less than 1% combined. Natural gas averaged 1.2%. Oil and diesel averaged 2.7% of generation.
12.
This territory generates most of its electricity from hydro.

Source and Description
Source: NEB
Description: This graph shows the composition of Yukon’s electricity generation between 2005 and 2016. Hydro generation averaged 93.8% from 2005 to 2016. Oil and diesel generation accounting for an average of 6.0%. Wind, solar and natural gas generated about 0.8% combined in 2016.
13.
This hydro province also generates a significant about of electricity from biomass, related to its forestry industry.

Source and Description
Source: NEB
Description: This graph shows the composition of B.C.’s electricity generation between 2005 and 2016. Hydro averaged 88.9% of generation. Wind increased from 0% in 2008 to 1.4% in 2016. Biomass doubled from 4.8% to 9.0%. Natural gas generation declined from 5.1% to 1.5% of generation from 2005 to 2016.
How many did you guess correctly? To learn more, see the NEB's electricity statistics and publications and Canada's Renewable Power Landscape 2017.
- Date modified: