Market Snapshot: How are energy projects financed?
Release date: 2018-12-12
Introduction
The energy industry is very capital-intensive. Projects often require an initial investment of billions of dollars to extract oil and gas, upgrade bitumen, refine crude oil, transport oil and gas products, or generate and distribute power. An upcoming LNG export project, LNG Canada, is expected to be the largest private sector project in Canada’s history at an estimated $40 billionFootnote 1. Annual combined investment in new and existing Canadian oil sands projects often exceeds $20 billion per year and peaked about $33 billion in 2014 before global oil prices dropped substantiallyFootnote 2. Overall, capital expenditure in Canada’s upstreamFootnote 3 oil and gas sector exceeded $40 billion in 2017Footnote 4.
When a company decides to build a large scale project, it needs to arrange funds to pay for the project. While the company may have excess cash generated internally from current operations or from asset sales, typically the company also needs to raise additional funds in the capital markets. The primary external sources of capital funds that the company may use are equity, debt, or some combination of the two.
The overall blend of equity and debt financing that a company uses across all lines of its business is called its “capital structure”. The cost to the company of each source of capital is a key determining factor in capital structure decisions and has significant implications for the profitability of individual projects and the overall business. Both industry specific, and overall economic market conditions, can influence the availability and cost of capital. Capital structure is commonly expressed as a percentage of equity to total capital and of debt to total capital, or as a total debt to total equity ratio.
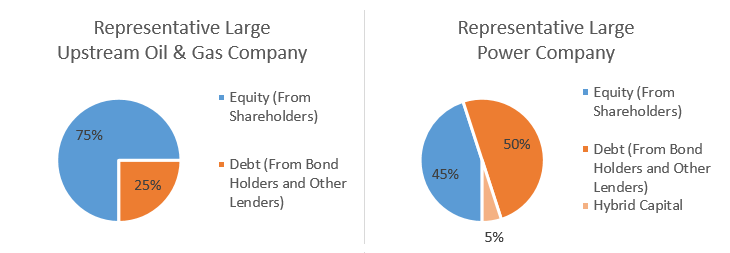
The capital structure of a company affects its financial risk level. As more debt is used, the company’s financial risk rises by increasing the likelihood of the company not being able to meet its financial obligations, including required debt payments. Therefore, the higher the company’s operational risk profile, the less debt it is likely to use in its capital structure. See Figure 1 for representative capital structures in the Canadian energy industry. Upstream companies tend to use more equity in their capital structure as these companies typically possess higher operating or other business risks, whereas pipeline and electricity companies typically use relatively more debt in their overall capital structure as these companies tend to carry lower business risk in the energy space.
Figure 1: Common Capital Structures Employed in the Canadian Energy Industry
Source and Description
Source: Thomson Reuters data and Company websites
Description: The pie chart on the left shows the capital structure of a representative large upstream oil & gas company as 75% equity and 25% debt. The pie chart on the right shows the capital structure of a representative large power company as 50% debt, 45% equity, and 5% hybrid capital.
Financing with Equity
Capital from equity sources comes from selling shares to shareholders, generally by issuing new common sharesFootnote 5 on public stock exchanges or through private placements. If the company has never issued shares on a stock exchange before, it is considered an Initial Public Offering (IPO).
Common shares give the purchaser direct ownership in the company, including profits from all of its projects. The company decides when and how much of its profits to retain inside the company versus to distribute to shareholders in the form of dividends or share repurchases:
- Dividends are the most common way shareholders are compensated by the company for investing in common shares. Dividends may be paid on a regular schedule, for example quarterly, or on an ad hoc basis. Pipeline and utility companies tend to have relatively stable operating cash flows, and thus typically pay a steady stream of dividends. Upstream oil and gas companies tend to have more variable operating cash flows, due in part to more exposure to commodity price risk and exploration or other technical risks, so dividend payments may be less certain.
- Share repurchases, or buybacks, are when the company uses its excess cash to buy back a certain amount of shares from investors either at current prices on the stock exchange or by using a tenderFootnote 6 process offering premium prices. The intended effect of buybacks is to increase the company’s share price and increase the proportionate share of profits for remaining shareholders going forward, since fewer shares are outstanding. Upstream oil and gas companies tend to use share buybacks more frequently than pipeline and utility companies, when they have large but sporadic cash receipts due, for example, to major projects coming online.
Table 1 shows that recent common share issuances in the energy industry largely have been done by oil sands and pipeline companies. In total, about US$35 billion has been raised by Canadian upstream oil and gas companies in equities markets in the past five years and almost US$100 billion in the overall Canadian energy industryFootnote 7. To provide a sense of perspective, Canadian companies across all industries raised about C$260Footnote 8 billion in the same period, with energy representing around 50% of the total.
| Issue Date | Issuer Name | Amount Issued (CAD million) | Issue Type |
|---|---|---|---|
| Upstream Oil and Gas | |||
| 31 May 2017 | Canadian Natural Resources Ltd | 4 000 | Follow-On |
| 29 March 2017 | Cenovus Energy Inc | 3 000 | Follow-On |
| 24 January 2017 | MEG Energy Corp | 518 | Follow-On |
| Pipeline and Utilities | |||
| 28 June 2018 | TransCanada Corp | 1 000 | Follow-On |
| 30 May 2017 | Kinder Morgan Canada Ltd | 1 000 | IPO |
| 6 December 2017 | Enbridge Inc | 1 500 | Follow-On |
| 25 January 2017 | AltaGas Ltd | 2 100 | Follow-On |
Source
Source: Company websites and corporate filings on SEDAR
Cost of Equity
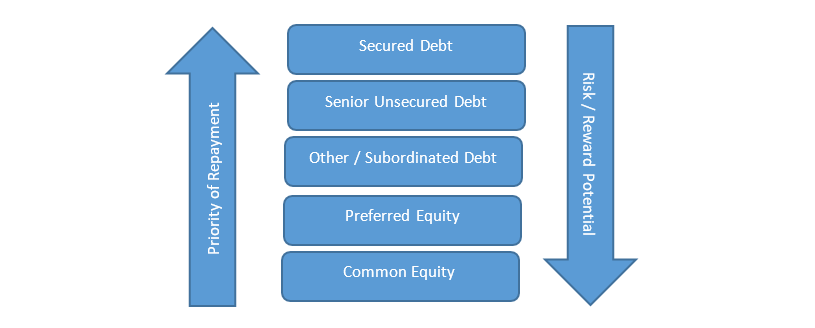
If the company runs into financial difficulties and is unable to pay all of its financial obligations, then lenders are contractually required to be repaid first. Common shareholders rarely receive sufficient payment for their investment as they are lowest in the repayment priority hierarchy (see Figure 2). Generally this makes investing in common shares riskier than investing in debt of the same company; therefore shareholders expect a higher potential return on their equity, making it relatively more costly for a company to issue equity than debt.
Figure 2: Repayment Priority Hierarchy of Various Financial Instruments
Source and Description
Source: NEB
Description: The figure shows that financial instruments with the highest priority of repayment are secured debt, followed by senior unsecured debt, then other/subordinated debt, then preferred equity, and finally common equity. The risk/reward potential for these instruments increases in the same order, with common equity having the highest risk/reward potential.
The cost of equity is the expected return an investor requires in order to be willing to invest in the company. The expected return includes a capital appreciation component as well as a dividend cash flow component. Calculating the cost to the company of using equity capital is a complex matter, and there are several techniques available for estimating cost of equity. Conceptually, cost of equity must take into account the risk premium, or reward, that shareholders demand for bearing the risk of investing in equities versus a relatively “risk-free” investment like Canadian government bonds. Additionally, it must compensate shareholders for the company’s specific risk level as compared to investing in an “average-risk” stock or benchmark indexFootnote 9 of the stock market which the company trades. Another approach indicates that the cost of equity must equate the current share price to all expected future cash flows to the shareholders.
Advantages of Using Equity
The key advantages for a company to use equity financing versus debt financing include:
- No direct repayment of initial capitalFootnote 10.
- No requirement that regular cash flows to be made to shareholders.
Ultimately, for the above two reasons, equity offers the company the most flexibility in terms of managing cash flows.
Disadvantages of Using Equity
Equity is typically the more costly source of capital as investors expect to be compensated for taking on this uncertainty of timing and amount of dividend cash flows and recovery of initial investment, particularly in the case of financial distress when equity holders may be left with nothing. Also as the company issues more common shares, it dilutesFootnote 11 value and control for existing shareholders.
Financing with Debt
Debt is an amount of funds that a company borrows from a lender with a contractual obligation to repay the full amount borrowed plus interest at an agreed-upon schedule. Lenders, also known as debt holders, do not receive any ownership in the company. Capital sourced from debt may come from banks, in the form of commercial paper or revolving lines of credit for example, or from investors who lend money by purchasing new bonds issued by the company.
Bonds are most commonly used as large value, long-term sources of capital to fund major projects rather than traditional bank debt, which is often used for short-term operational financing. The company must pay bondholders a regularly scheduled return on their investment similar to interest payments, which are called coupon payments. Coupons are expressed as a percentage of the bond’s face value or par value. The company must later pay bondholders a return of their capital though repayment of the principal amount at the bond maturity date. Bonds typically have a maturity date that is 10 to 30 years in the future, often matching the economic life of the company’s project.
Recent large value debt issuances in the Canadian energy industry (shown in Table 2) have been done primarily by pipeline and utility companies as they have relatively more stable, lower-risk cash flows that can be used to meet required interest or coupon payments. Notwithstanding, roughly US$100 billion has been raised by Canadian upstream companies and US$300 billionFootnote 12 in the broader Canadian energy industry in the corporate bond markets in the past 5 years. The total amount raised in the corporate bond markets by all Canadian companies over the same time period was C$1.4Footnote 13 trillion, with energy companies accounting for roughly 30% of the total.
| Issue Date | Issuer Name | Coupon (%) | Maturity | Amount Issued (CAD million) |
|---|---|---|---|---|
| Pipeline and Utilities | ||||
| 3 July 2018 | TransCanada Pipelines Ltd | 4.18 | 3 July 2048 | 800 |
| 22 November 2017 | Union Gas Ltd | 2.88 | 22 November 2027 | 250 |
| 22 November 2017 | Union Gas Ltd | 3.59 | 22 November 2047 | 250 |
| 15 September 2017 | TransCanada Pipelines Ltd | 3.39 | 15 March 2028 | 300 |
| 15 September 2017 | TransCanada Pipelines Ltd | 4.33 | 16 September 2047 | 700 |
| Refinery Companies | ||||
| 19 May 2017 | North West Redwater Partnership | 2.80 | 1 June 2027 | 750 |
| 19 May 2017 | North West Redwater Partnership | 3.65 | 1 June 2035 | 750 |
Source
Source: Company websites and corporate filings on SEDAR
Cost of Debt
The cost of debt to the company is the specified interest rate or coupon rate that the company is required to pay to lenders (banks, bondholders) in order to entice them to lend. The cost of debt that a company can achieve is highly dependent on the company’s financial risk, or more specifically its credit risk, which is the risk that the company will not be able to pay its financial obligations in full and on time. Third party rating agencies assign credit ratingsFootnote 14 to companies and to individual debt issues. The lower the credit rating, the more costly it is for the company to finance using debt, as lenders expect to be compensated for taking on higher risk.
Other factors that influence the cost of debt include the time to maturity of the particular bond as well as current and expected future interest rates over that time period; these factors define the yield curve for companies with the same credit rating. In a rising interest rate environment, bondholders will expect higher rates of return in order to be willing to invest in corporate bonds as opposed to less risky government bonds. Additionally, seniority or priority of debt impacts the cost of that debt since in times of financial distress secured debt holders are repaid first, followed by senior unsecured debt holders, and finally by subordinated debt holders (see Figure 2); the higher in the priority hierarchy, the lower the cost of that debt, all else equal.
Advantages of Using Debt
The primary advantages for a company to use debt versus equity include:
- It is generally the least costly source of capital since debt holders receive regular payments with greater certainty than equity holders do with dividends. Table 2 shows that recent debt costs are in the low to mid-single digits for large investment grade energy companies.
- The interest and coupon payments are tax deductible whereas dividend payments are not, therefore further lowering the net cost of debt.
- Debt holders do not receive any ownership stake, therefore, using debt does not dilute shareholders’ interests.
Disadvantages of Using Debt
The company has a contractual obligation to adhere to interest and principal repayment schedules or risk facing default, and in the worst case, bankruptcy. The more debt that a company takes on, the higher its financial risk, and eventually the higher its future debt issuance costs may become.
Financing with Hybrid Instruments
In addition to raising funds by issuing traditional equity or debt, a third and less common source of capital that companies may use is called hybrid capital. Hybrid instruments have both debt and equity characteristics, and typically fall in the middle of the priority of repayments in the event of a default. This includes financial instruments such as preferred shares and convertible bonds:
- Preferred shares pay a regular fixed dividend that is required to be paid before any dividends can be paid to common shareholders. Preferred shareholders are higher in the repayment priority hierarchy, so they are more likely than common shareholders to receive some initial investment back; however they typically do not get voting rights like common shareholders do. The cost to the company of using preferred equity is generally less than using common equity, but the company has less dividend payment flexibility with preferred shares.
- Convertible bonds have characteristics that look similar to regular bonds; however bondholders of convertibles have the option to convert their bonds into a predetermined number of common shares, at which point they would become equity holders rather than debt holders, and participate in upside growth of the company. Convertible bondholders are lower in the repayment priority hierarchy than regular bondholders. The company’s cost of capital on convertibles is generally less than using equity.
Energy companies, particularly pipeline, power, and other utility companies, are becoming more reliant on hybrid capital; hybrid accounts for approximately 3 to 6%Footnote 15 of the capital structure for companies in those industry segments. Companies have been looking for more flexible financing for large energy infrastructure projects, especially since the 2014 global oil price dip that contributed to lower share prices and higher debt levels. Companies, especially pipeline companies, strive to maintain attractive credit ratings. Often hybrid capital may be treated more like equity by credit rating agencies so new hybrid issuances may not negatively impact the company’s credit rating.
Table 3 lists recent large value preferred share issuances in the energy industry, showing that preferreds tend to be used by pipeline companies in recent years. Approximately US$13 billionFootnote 16 has been raised in preferred share issues in Canada’s energy industry since January 2017 and roughly C$50Footnote 17 billion has been raised by Canadian companies across all industries in the past 5 years. In Enbridge Inc’s 2018 Investor PresentationFootnote 18, management indicated plans to raise more than $3 billion over the next few years in hybrid capital, showing the growing importance of hybrid capital in the Canadian energy industry.
| Issue Date | Issuer Name | Coupon (%) | Amount Issued (CAD million) |
|---|---|---|---|
| Pipeline and Utilities | |||
| 17 May 2018 | Emera Inc | 4.90 | 300 |
| 15 December 2017 | Kinder Morgan Canada Ltd | 5.20 | 250 |
| 11 December 2017 | Enbridge Inc | 4.90 | 500 |
| 7 December 2017 | Pembina Pipeline Corp | 4.90 | 400 |
| 15 August 2017 | Kinder Morgan Canada Ltd | 5.25 | 300 |
Source
Source: Company websites and corporate filings on SEDAR
Aggregate Capital Raised
Canadian companies, both overall, as well as those in the energy industry, have raised significantly more funds in the corporate bond market as compared to equities markets over the past decade. Bank of Canada statistics show that overall Canadian companies’ use of bonds exceeded use of equity in 2017 with about C$275 billion raised in corporate bonds and C$85 billion raised in equity capital markets.
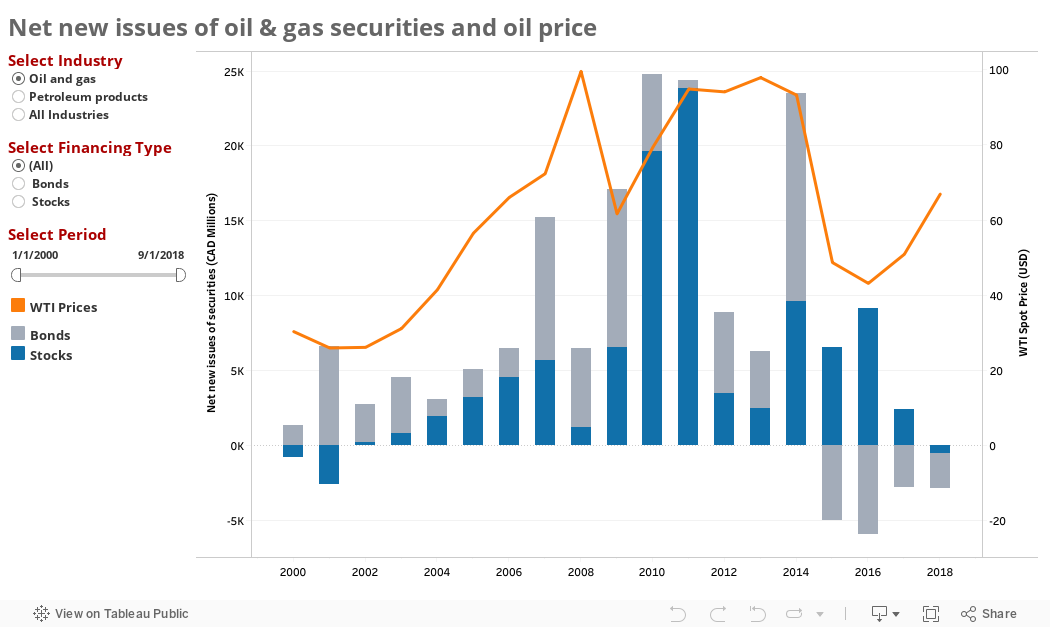
Prevailing energy commodity market conditions have a clear impact on capital markets; at the same time, capital market conditions contribute to future energy commodity market outcomes. Canadian upstream oil and gas companies combined only issued a net of -C$2.8 billion in bonds and C$2.4 billion in equity in 2017Footnote 19 (see Figure 3). This indicates that a large volume of bond retirements and stock repurchases were occurring at roughly the same pace as new issuances. Since the global oil price drop in 2014 and subsequent drop in Canadian interest rates, many companies have been redeeming bonds to take advantage of new lower costs of borrowing, as well as buying back shares at depressed prices to add shareholder value and support share prices.
Figure 3: Bank of Canada: Net New Stock and Bond Issuances by Upstream Companies
Source and Description
Source: Bank of Canada Statistics, EIA crude prices
Description: The interactive chart shows the trends of stock and bond net new issues by upstream oil & gas companies since 2000, with net new stock issues in negative territory in 2000/2001, followed by growth in the early to mid-2000s until peaking in 2011 at C$ 23.9 billion. This growth trend largely corresponded with WTI oil price movements, and both WTI prices and net new issues dropped sharply in recent years. 2018 YTD has -$524 million in net new stock issues. The net new bond issuances for oil & gas companies was positive but widely fluctuated during 2000 through 2014, and has since been negative and at -$2.4 billion in 2018 YTD. In contrast, net new issues of stocks and bonds across all industries in Canada has been positive since 2000.
Disclaimer:
This report is provided for informational purposes only and should not be used in making investment decisions.- Date modified: