Market Snapshot: Canada’s historical GHG emissions – Update
Release date: 2019-01-16
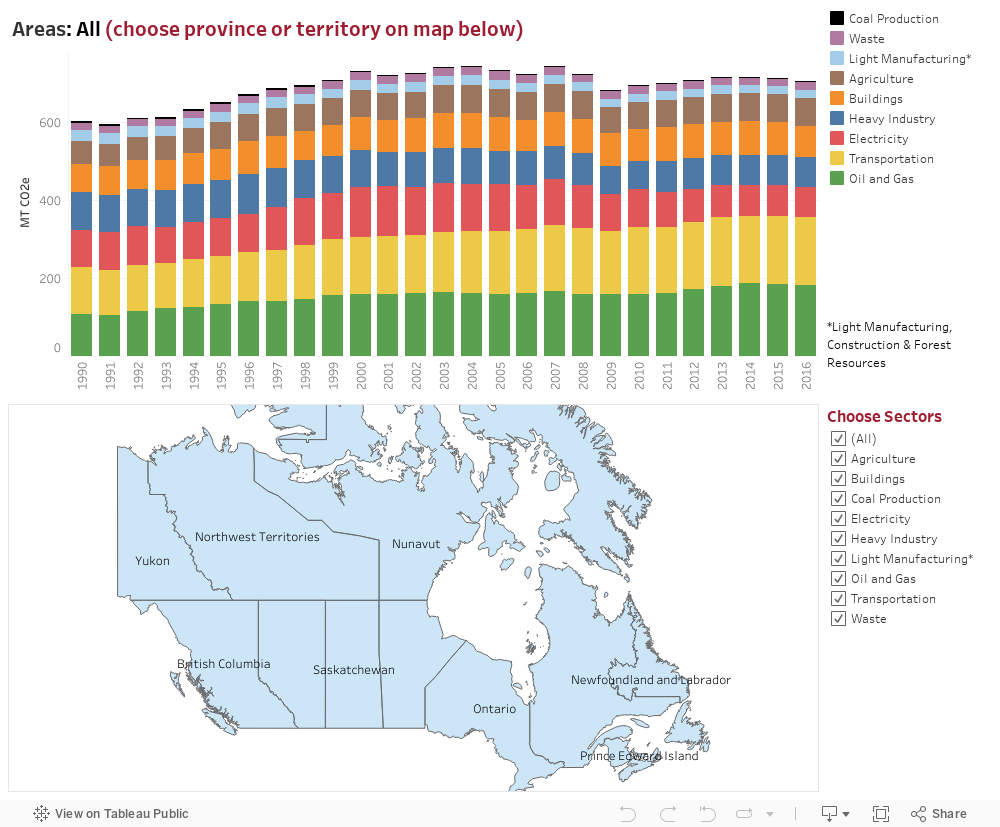
Explore this interactive chart which contains data on Canadian greenhouse gas emissions (GHGs) by province, territory, and sector. GHGs are measured in megatonnes of CO2 equivalent (MT CO2e).
Annual provincial and territorial GHG emissions by sector
Source and Description
Source: National and Provincial/Territorial Greenhouse Gas Emission Tables
Description: The stacked column graph above shows GHG emissions by sector in Canada from 1990 to 2016. Overall, GHG emissions in Canada increased from 602 MT CO2e in 1990 to 704 MT CO2e in 2016, after peaking at 745 MT CO2e in 2007. Since 1990, the oil and gas sector and transportation sector have been the largest emitters. Click the link above to access the full data set.
- Date modified: