Market Snapshot: Ontario’s electricity demand continues to decrease as market demands and efficiencies evolve
Release date: 2019-04-24
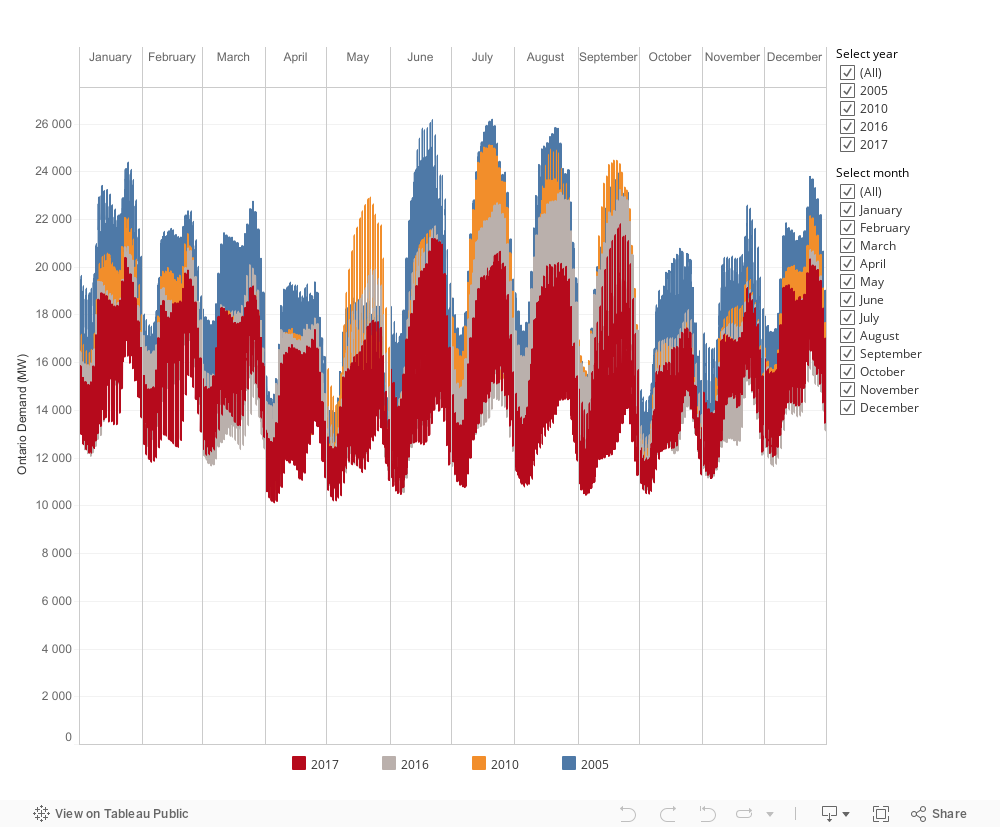
In 2017 Ontario’s peak electricity demandFootnote 1 decreased to 22 GW from 26 GW in 2005. Overall, Ontario’s electricity demand has decreased steadily between 2005 and 2017. Ontario’s total electricity demandFootnote 2 fell to 132 TW.h in 2017 from 157 TW.h in 2005 (a 16% drop). The reduction in demand is mainly from reduced industrial demand and increased energy efficiency.
Figure 1: Ontario hourly electricity demand
Source and Description
Source: IESO
Description: This chart shows Ontario’s hourly electricity demand in megawatts in 2005, 2010, 2016, and 2017. The horizontal axis shows each day in the month for every hour in a day (1 to 24). The lines represent the hourly demand for each year. Overall, this chart shows there is a steady decrease in demand from 2005 to 2017.
In a previous Market Snapshot, the NEB showed how Ontario's decrease in electricity demand is visible at each hour of the day. The snapshot highlighted that peak demand for the average day in 2016 was 9% lower than the peak demand for the average day in 2005.
- Date modified: