Market Snapshot: Western Canadian crude oil supply, markets, and pipeline capacity – graph and data supplement
Release date: 2019-01-09
The National Energy Board (NEB) recently released a report called Western Canadian Crude Oil Supply, Markets, and Pipeline Capacity after The Honourable Minster Sohi asked the NEB for advice. This snapshot contains some of the graphs used in this report as well as the data used to produce them.
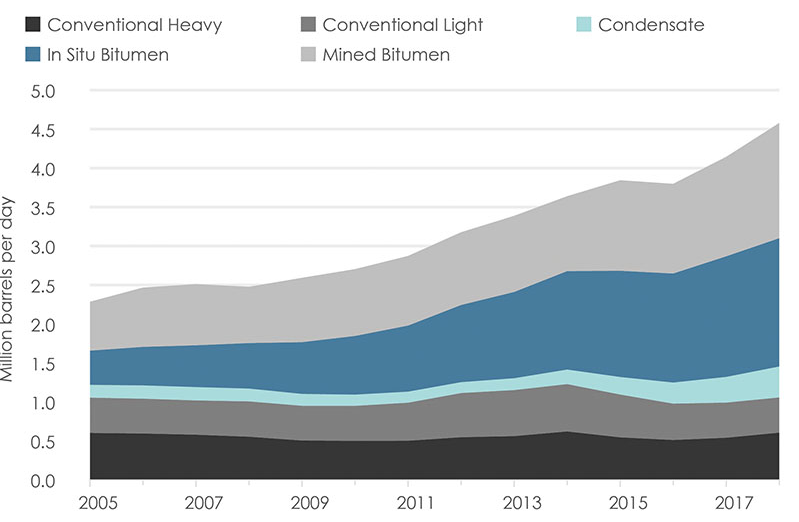
Figure 1. Crude Oil Production from the WCSB: 2005 to 2018
Source and Description
Source: NEB, Canada’s Energy Future: 2018
Description: This area graph illustrates total WCSB crude oil and equivalents production from 2005 to 2018. Data to 2017 is historical, while data for 2018 is estimated. Conventional heavy production declined from 0.60 million b/d in 2005 to 0.54 million b/d in 2017. Conventional light production remained flat at 0.45 million b/d in 2005 to 0.45 million b/d in 2017. Condensate production was 0.17 million b/d in 2005 and increased to 0.33 million b/d in 2017. In situ bitumen production increased from 0.44 million b/d in 2005 to 1.5 million b/d in 2017. Mined bitumen production increased from 0.63 million b/d in 2005 to 1.3 million b/d in 2017. Total WCSB production has increased from 2.28 million b/d in 2005 to 4.14 million b/d in 2017. Estimated total WCSB production for 2018 is 4.58 million b/d.
- Download the crude oil production data used to create the chart above: Crude Oil Production Data [EXCEL 16 KB].
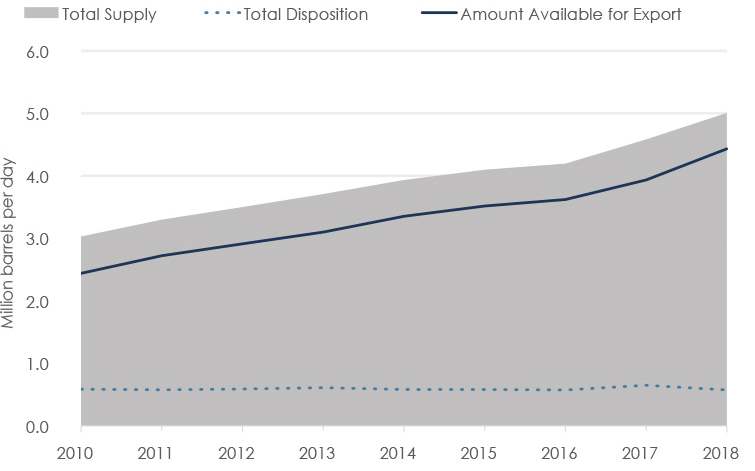
Figure 2. WCSB Crude Oil Supply and Disposition: 2010 to 2018
Source and Description
Source: NEB, Canada’s Energy Future: 2018
Description: This combined area and line chart illustrates historical and projected western Canadian crude oil supply and disposition, and oil available for export between 2010 and 2018. In 2010, total average annual supply was 3.0 million b/d, rising to an estimated 5.0 million b/d in 2018. The annual average oil available for export over the same period grew from 2.4 million b/d to an estimated 4.4 million b/d.
- Total disposition data for this graph is confidential. Download the total supply data used to create the chart above: Total Supply Data [EXCEL 16 KB].
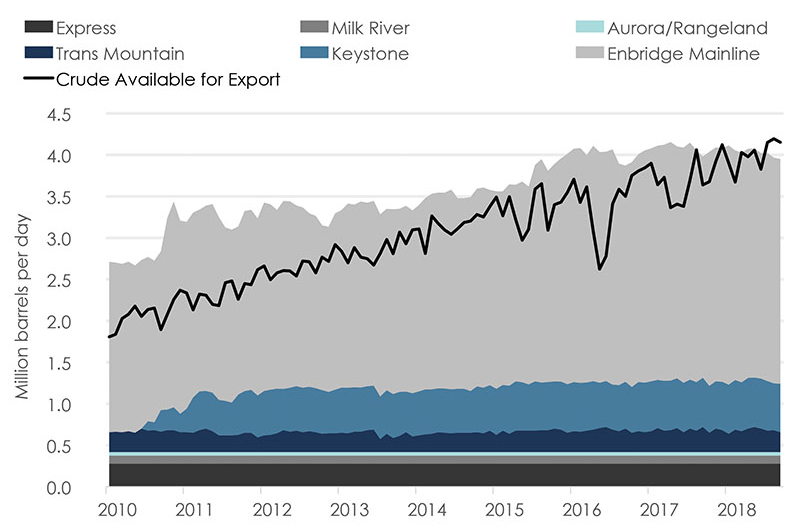
Figure 3. Pipeline Capacity and Crude Oil Available for Export from the WCSB
Source and Description
Source: NEB
Description: This combined area and line chart illustrates estimated takeaway capacity and crude oil available for export from the WCSB.
- Crude oil available for export is confidential. Download the supply and pipeline capacity data used to create the chart above: Supply and Pipeline Capacity Data [EXCEL 20 KB].
Note: The data used for the crude oil takeaway capacities from WCSB pipelines are as follows:
Trans Mountain, Keystone, and Enbridge Mainline report monthly available capacity to the NEB. This data is available on the NEB’s Pipeline Profiles.
Aurora, Express, and Milk River are Group 2 pipelines as described in Guide P.6 of the NEB’s Filing Manual. Group 2 pipelines are exempt from reporting monthly capacity and throughput. Values shown are the nameplate capacities of these pipelines less 1% to account for the average difference between nameplate and available capacities of similar lines (Keystone and Trans Mountain).
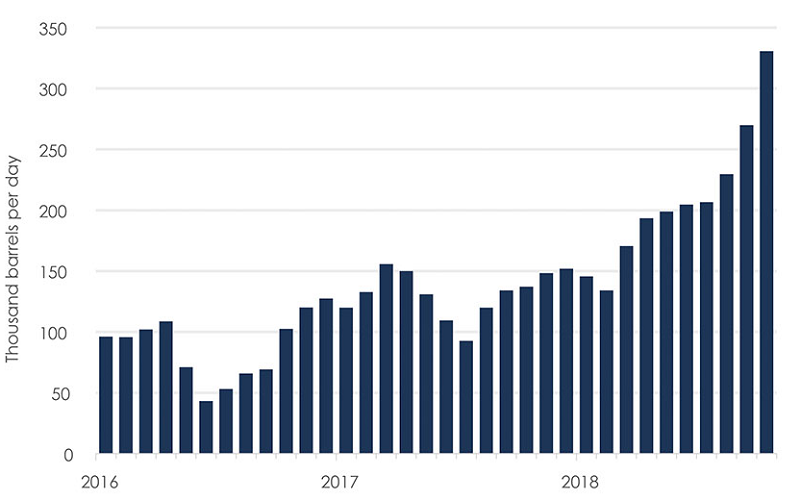
Figure 4. Monthly Volumes of Crude-by-Rail Exports from Canada
Source and Description
Source: NEB, Canadian Crude Oil Exports by Rail
Description:This column chart illustrates crude-by-rail exports from Canada between January 2016 and October 2018. In 2016, crude-by-rail exports averaged 88 000 b/d. In 2018, exports averaged 206 000 b/d and reached a record high of 327 229 b/d in October 2018.
- Download the monthly volumes of crude-by-rail export data used to create the chart above: Monthly Volumes of Crude-by-Rail Export Data [EXCEL 20 KB].
Pipeline apportionment occurs when shippers want to transport more oil than the pipeline can accommodate in a month. Apportionment is the percentage by which each shipper’s nominated volume is reduced in order to meet the capacity that the pipeline has available.
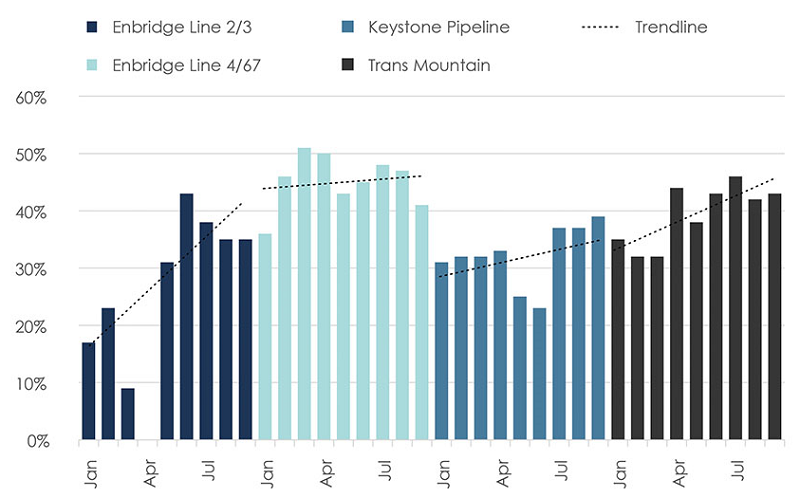
Figure 5. Apportionment on Select NEB-Regulated Pipelines in 2018
Source and Description
Source: NEB
Description:These column charts illustrate the apportionment percentages on Enbridge Line 2/3, Enbridge Line 4/67, the Keystone Pipeline System, and the Trans Mountain Pipeline for January 2018 to September 2018. Each chart includes a trend line that highlights the change in apportionment percentages over time.
- Download the apportionment data used to create the chart above: Apportionment Data [EXCEL 20 KB].
Note: Data for the crude oil pricing graphs are from Net Energy Exchange and proprietary.
- Date modified: