Market Snapshot: U.S. gas continues to displace western Canadian gas in Quebec and Ontario
Connect/Contact Us
Please send comments, questions, or suggestions for Market Snapshot topics to snapshots@cer-rec.gc.ca
Release date: 2021-06-30
Prior to 2008, demand for natural gas in Quebec and Ontario was largely met with domestic production from western Canada transported on the northern Ontario line (NOL) of the TC Canadian MainlineFootnote 1. In recent years, the NOL has been supplying less gas to eastern Canada, despite growing demand.
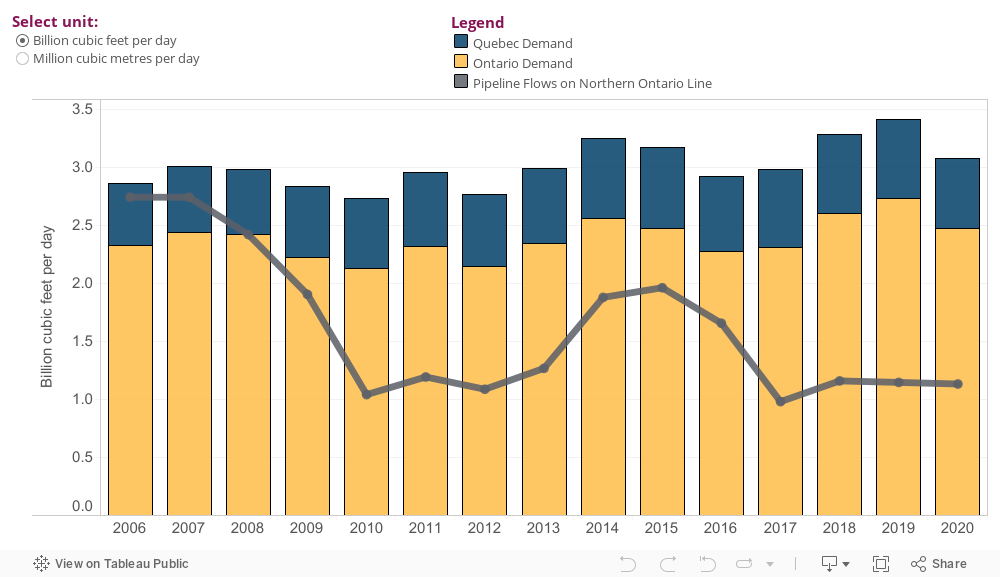
Figure 1: Natural Gas Demand in Ontario and Quebec and Pipeline Flows on the NOL Segment of TC Canadian Mainline
Source and Description
Source: Canada’s Energy Future 2020 (the data between 2006 and 2018 are actuals and the data for 2019-2020 are projections), Pipeline Throughput and Capacity Data
Description: This combination stacked bar and line chart shows annual Ontario and Quebec demand for natural gas since 2006 stacked vertically, as well as pipeline deliveries on the NOL displayed as a grey line. The line chart shows that the amount of gas supplied from western Canada on the NOL declined from 2.8 billion cubic feet per day (Bcf/d) or 79.3 million cubic metres per day (106m³/d) in 2006 to 1.1 Bcf/d (31.1 106m³/d) in 2020. Total demand for natural gas in Ontario and Quebec increased from 2.9 Bcf/d (82.1 106m³/d) in 2006 to a peak of 3.4 Bcf/d (96.3 106m³/d) in 2019 before falling to 3.1 Bcf/d (87.8 106m³/d) in 2020.
The decline in flows on the NOL since 2006 is largely attributable to growing U.S. Northeast gas production and increased imports of U.S. gas into eastern Canada. Particularly, horizontal drilling and new production technology made gas cheaper to produce and enabled production from the U.S. Appalachian Basin to increase over tenfold between 2010 and 2020, rising from 2.7 Bcf/d (76.5 106m³/d) to 33.7 Bcf/d (954.3 106m³/d).Footnote 2 New low-cost drilling methods and the Appalachian Basin’s close proximity to eastern Canadian markets made U.S. Northeast gas more competitive in Canada, leading to more U.S. gas imported and consumed in eastern Canadian markets.
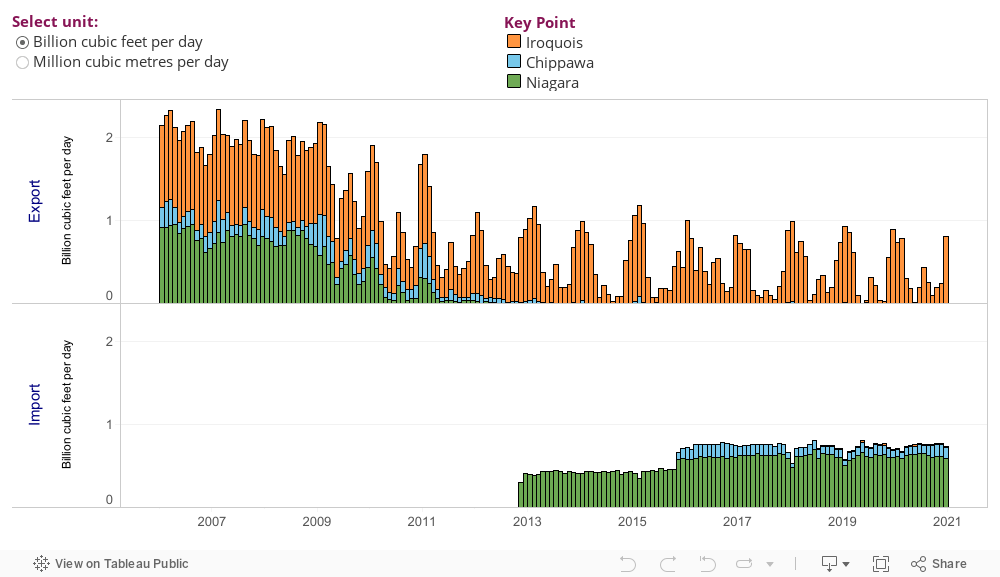
Figure 2 shows the decline of exports and growth of imports at three key points in Ontario: Niagara, Chippawa, and Iroquois. Imports at these key border points increased 31% over the past five years with most of the volumes coming through Niagara. Imported gas at these points is supplied with production from the Appalachian Basin.
Figure 2. Natural Gas Exports and Imports at Key Points in Ontario
Source and Description
Source: Pipeline Throughput and Capacity Data (CER)
Description: The first stacked bar chart shows natural gas exports declining between 2006 and 2021. Exports continue at Iroquois but are largely seasonal (primarily in the winter), while exports at Chippawa and Niagara have declined to zero. The second stacked bar chart shows the rise in natural gas imports at Niagara, Iroquois, and Chippawa. Niagara imports the most gas, followed by Chippawa, while only small volumes are imported at Iroquois.
Source: Suncor
In addition to the NOL and imports at Chippawa, Niagara, and Iroquois; Ontario and Quebec are supplied with natural gas from storage. Southern Ontario is home to a series of natural gas storage facilities (known as the Dawn HubFootnote 3), which is supplied with natural gas from several producing areas in North America, including the Western Canada Sedimentary Basin (WCSB) and the Appalachian Basin. In recent years, the construction of new pipelines in the U.S. (including Rover and Nexus) brought more U.S. production into the Dawn Hub, increasing options for supply for customers in Ontario and Quebec.
Western Canadian gas production grew over the past decade from 14.2 Bcf/d (403.0 106m³/d) in 2010 to 15.4 Bcf/d (436.5 106m³/d) in 2020Footnote 4, and flows have been re-adjusted to other markets in response to displacement in Ontario and Quebec. Particularly, more western Canadian gas now meets increased demand in Alberta from the growing power generation and industrial sector. Similarly, exports of western Canadian gas have now shifted and supply more to the U.S. Pacific NorthwestFootnote 5 after being crowded out of the U.S. Northeast. See the Pipeline Capacity and Utilization section of CER’s Canada’s Pipeline System 2021: Economics of CER-Regulated Infrastructure report for more information.
- Date modified: