Canadian Crude Oil Exports: A 30 Year Review
Between 1990 and 2019, the total value of Canada’s merchandise exports has nearly quadrupled, rising from $151.8 billion to $598.2 billion. Over those 30 years, the value of crude oil exports has increased more than fifteen-fold, accounting for 14.1% of Canada’s total exports in 2019.
The Canada Energy Regulator (CER) and Statistics Canada have combined expertise to put together a 30-year look back at the evolution of Canadian crude oil exports. This retrospective highlights some of the factors that influenced the trends in Canadian crude oil exports, coupled with other key indicators, including impacts on Canadian balance of trade, crude oil production, and industry investment.
The Canada Energy Regulator and Statistics Canada have a longstanding relationship in terms of sharing data, information and expertise, as well as providing Canadians with high quality data and informative analysis on energy issues.
This collaboration has led to improvements in both the consistency of the datasets produced by each agency and the overall quality of the data. A data user guide, Reconciling Canada Energy Regulator and Statistics Canada Crude Oil Export Data, has been produced to explain the differences in the concepts and methodologies applicable to the datasets published by each agency.
COVID-19 IMPACTS
The COVID-19 pandemic significantly impacted all aspects of the global oil supply and consumption chain, including Canadian exports. While 2020 data and analysis is available in the “Preliminary Look at 2020” section below, this retrospective is mainly focused on the years 1990-2019. Further analysis will be required to determine the extent of the impact of the COVID-19 pandemic on the crude oil sector.

The CER’s Canada’s Energy Future 2020 provides a more detailed look at the COVID-19 impact on Canadian energy supply and demand.
The CER’s Crude Oil Export Summary provides an overall summary of crude oil exports with aggregated data for 5 previous years, examining volumes, prices, values, modes of transport and destinations.
In addition, the CER’s Market Snapshots examine the impact of the pandemic on various aspects of the Canadian energy system, including crude oil.
Statistics Canada’s Energy Statistics, December 2020 provides analysis of energy data and the year in review, including analysis of COVID-19 impacts.
Additionally, Statistics Canada’s International Trade Annual Review provides data and analysis on international trade in 2020, including coverage of the impacts of COVID-19 on Canada’s exports of crude.
Canadian Oil Production
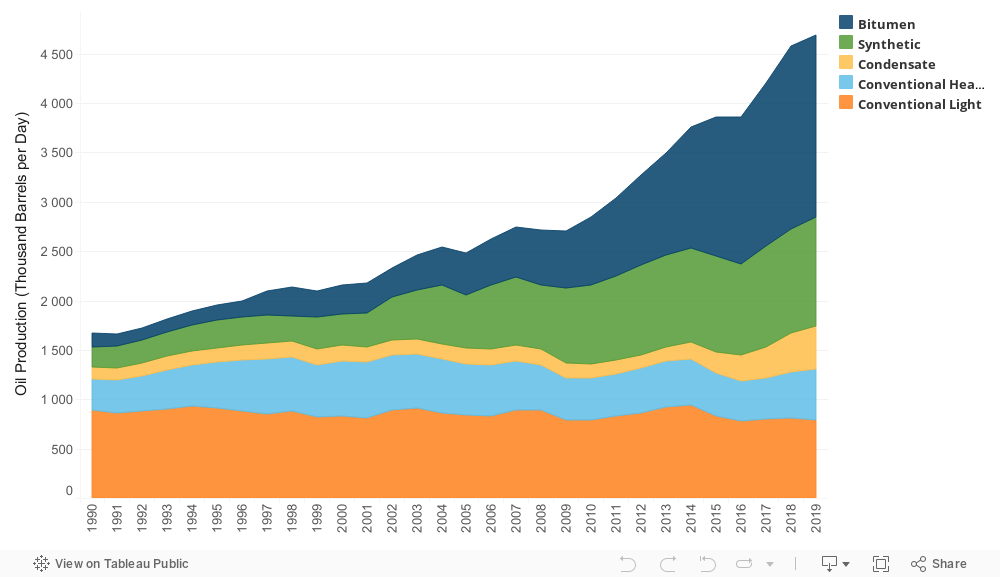
In the last 30 years, Canadian crude oil* production grew at a sustained pace, first led by conventional oil*, and for the last 15 years by oil sands*.
Canadian crude oil production has grown considerably over the last 30 years, from 1.7 million barrels per day (b/d) in 1990 to 4.7 million b/d in 2019. Conventional types of oil, light and heavy, combined with condensate* dominated in the 1990s and early 2000s, with production from oil sands deposits in Alberta becoming the largest contributor to Canadian production starting in 2009.
Figure 1. Annual Canadian Crude Oil Production by Crude Oil Type
Source and Description
Source: CER Estimated Production of Canadian Crude Oil and Equivalent.
Description: This stacked area chart shows annual Canadian crude oil production from 1990 to 2019. There are five types of crude oil in the chart: conventional light oil, conventional heavy oil, bitumen, condensate, and synthetic oil. The chart shows the levels of production in thousand barrels per day over the thirty year period, with growth particularly evident in bitumen and synthetic oil from 2008 to 2019.
Crude Oil Export Volumes
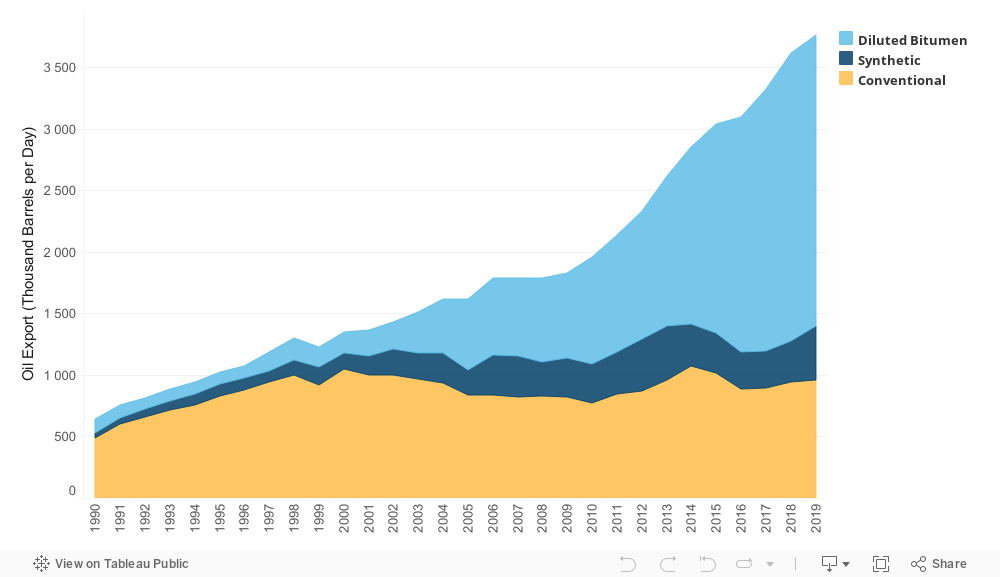
Canadian exports increased more than fivefold over the past 30 years.
Figure 2. Annual Canadian Crude Oil Exports by Type
Source and Description
Source: CER Crude Oil Export Summary by Type, Commodity Tracking System, CER Calculations.
Description: This stacked area chart shows annual Canadian crude oil export volumes from 1990 to 2019. There are three types of crude oil included in the chart: diluted bitumen, synthetic, and conventional oil. The chart shows the levels of exports in thousand barrels per day over the thirty year period, with growth particularly evident in diluted bitumen from 2002 to 2019.
Between 1990 and 2019, Canadian oil exports increased at an annual average rate of 6.2%. Bitumen* is a very viscous and dense substance that must be heated to flow and is unsuitable for transportation on pipelines over long distances. Before selling bitumen to markets, it must be either upgraded to a lighter crude oil (named synthetic crude oil* or SCO) or blended with lighter hydrocarbons (condensate*, naphtha* or SCO). Synbit is the term used when bitumen has been blended with SCO, while a blend of bitumen and condensate is called dilbit. As condensate production in Canada is insufficient to cover oil sands demand for diluent, imported condensate is also used.
High oil prices in the late 2000s and early 2010s underpinned expansion of Canadian oil production and exports. In particular, from 2010 to 2015 heavy oil exports increased by an annual average rate of 12.5%, due primarily to increased production from the oil sands. Light oil exports also increased, though to a lesser extent. Between 2010 and 2015, light oil exports grew by an annual average rate of 2.9%, reinforced by offshore developments in Newfoundland and Labrador, expansions in oil sands upgrading, and new light oil production technology in western Canada.
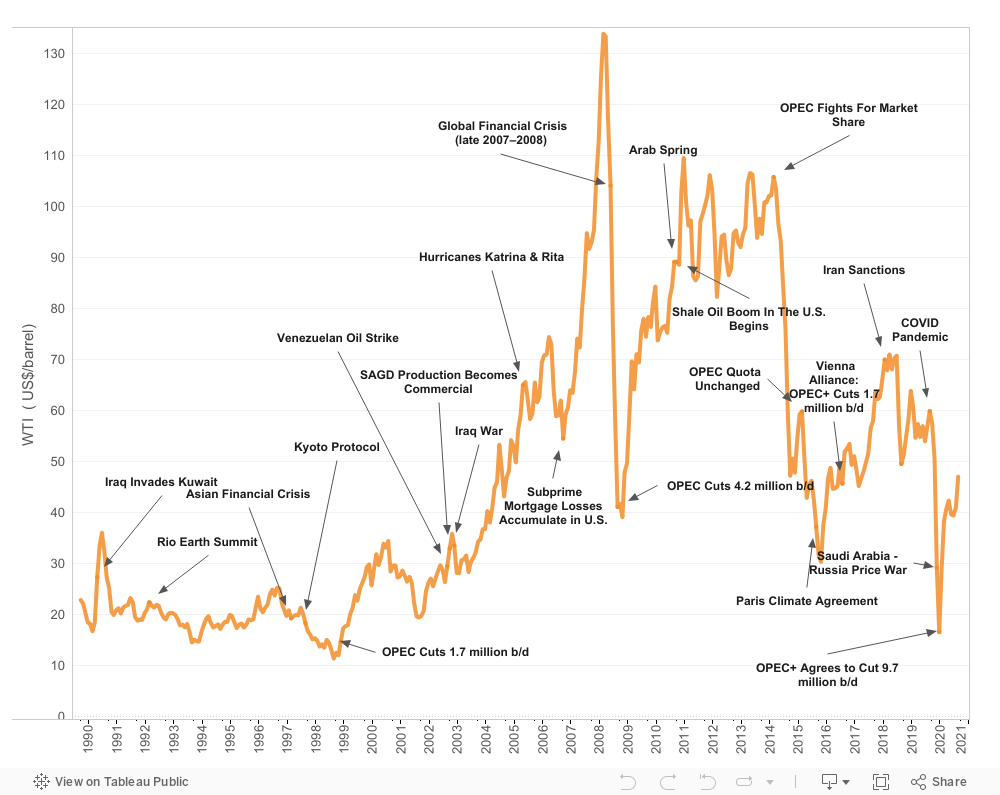
Evolution of World Oil Prices
Canadian oil export values impacted by volatile world oil prices.
Figure 3. Significant Oil Market EventsFootnote 1,2,3
Source and Description
Source: U.S. Energy Information Administration, Spot Prices, Petroleum & Other Liquids.
Description: The line chart depicts the average monthly West Texas Intermediate (WTI) oil price in US dollars per barrel from 1990 to 2020. The WTI price remained within the $10 to $40 per barrel (USD) range until significant price increases began in the mid-2000s, with the price peaking above $130 in 2008. Following a sudden decline to around the $40 mark in late 2008, prices resumed climbing, sometimes surpassing the $100 mark until late 2014. Between late 2014 and 2019, prices have moved between the $30 to 75$ range, before dropping below $20 in early 2020 and then rebounding to the $40 to $50 range a few months later. Significant events impacting the oil price (including political, environmental, financial, technological) are identified on the line chart. Specific events listed are: Iraq invades Kuwait (1990); Rio Earth Summit (1992); Asian Financial Crisis (1997); Kyoto Protocol (1997); OPEC Cuts 1.7 million b/d (1998); Venezuelan Oil Strike (2002); SAGD Production Becomes Commercial (2002); Iraq War (2002); Hurricanes Katrina & Rita (2005); Subprime Mortgage Losses Accumulate in U.S. (2006); Arab Spring (2010); Shale Oil Boom in the U.S. Begins (2011); OPEC Fights For Market Share (2014); OPEC Quota Unchanged (2014); Paris Climate Agreement (2015); Vienna Alliance Cuts 1.2 million b/d (2016); Iran Sanctions (2017); OPEC+ Cuts 1.2million b/d (2018); COVID Pandemic (2019); Saudi Arabia – Russia Price War (2019); OPEC+ Agrees To Cut 9.7 million b/d (2020).
Source: Cenovus
Crude oil prices can be volatile, and are affected by any number of supply, market or geopolitical events around the world. That said, similar to other commodities, prices are ultimately driven by the dynamics of supply and demand, or the perception that market participants have of either.
West Texas intermediate* (WTI) is North America’s light, sweet crude oil benchmarkFootnote 4 based in Cushing, Oklahoma. Since the United States is the main market for Canadian crude oils, their pricing is most often based on the price of WTI. The graph above shows some of the events over the past 30 years that have impacted North American oil prices, and due to the exceptional events of 2020, that year has been included in this graph.
From 1990 to 2007, prices rose considerably and with less volatility than the period that followed. Prior to 2008, conventional crude oil production was responsible for the majority of the world’s crude oil supply. Prices increased in part because conventional drilling was challenged to unlock a sufficient amount of crude oil to meet growing demand. In 2008, however, the application of multi-stage hydraulic fracturing and horizontal drilling meant the world was moving from a period of oil scarcity to one of abundance.
From 2008 onward, prices became more volatile, notably affected by individual market and geopolitical events.
Crude Oil Export Values
Crude oil rises to become Canada’s top exported product.
Canadian crude oil export values rose significantly over the past 30 years. While export volumes increased steadily over time, volatility in export prices has generally driven the trends observed in the value of these exports. Over the past 30 years, crude has continually been one of the top five commodities exported from Canada, often alternating with passenger cars and light trucks as the top exported product.
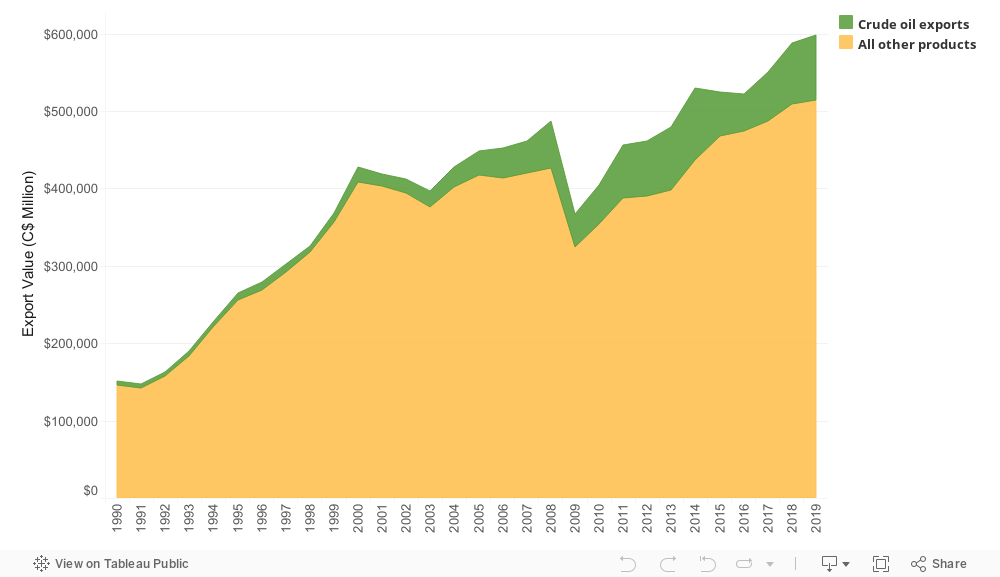
In 1990, exports of crude oil were valued at $5.5 billion, representing 3.6% of total Canadian exports. Canada’s top exported product at that time was passenger cars and light trucks ($21.8 billion, or 14.3% of total exports). In 2008, crude oil surpassed passenger cars and light trucks to become Canada’s top exported product. The value of crude oil exports reached a peak in 2014 at $92.6 billion, or 17.5% of total exports. After posting sharp declines in 2015 and further declines in 2016, due to a drop in export prices, crude oil was supplanted by passenger cars and light trucks as Canada’s top exported product. In 2017, crude oil export values resumed their climb and was once again Canada’s top exported product by 2018. In 2019, the value of these exports reached $84.3 billion, representing 14.1% of total Canadian exports.
Figure 4. Export Value of Canadian Crude Oil and All Other Products
Source and Description
Source: Statistics Canada, Table 12-10-0121-01, International merchandise trade by commodity, monthly (x1 000 000).
Description: The stacked area chart shows the annual value of Canadian crude oil exports and all other exports, in millions of dollars, from 1990 to 2019. Growth in the value of exports of both crude oil and all other exports is evident over the 30 year period, and the share of crude oil exports in total exports increased by 2019.
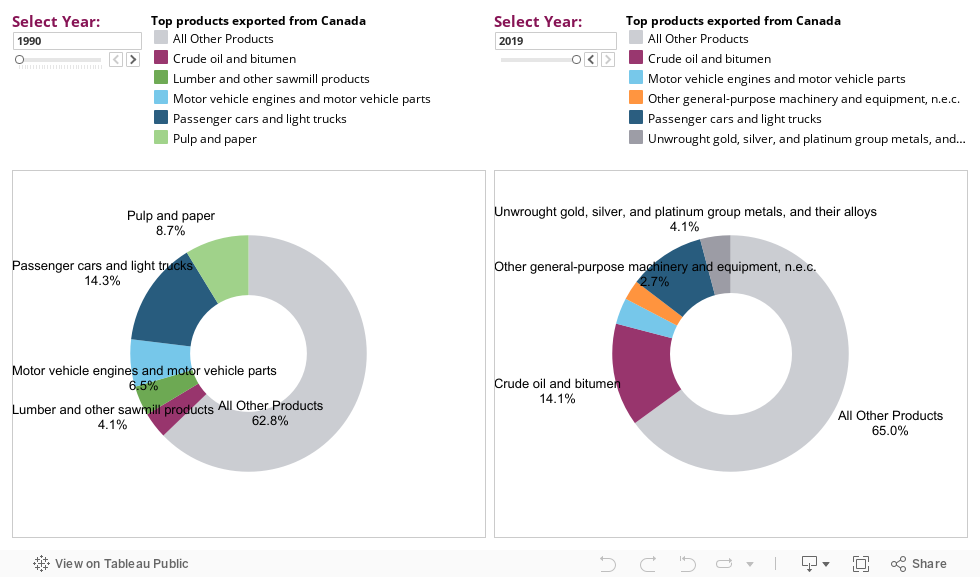
Figure 5. Top Exported Products from Canada 1990 vs. 2019
Source and Description
Source: Statistics Canada, Table 12-10-0121-01 International merchandise trade by commodity, monthly (x1 000 000).
Description: The interactive donut chart shows top products exported by Canada by year from 1990 to 2019. Values in Canadian dollars and percent share of total exports are shown. The products shown in the donut chart are categorized by NAPCS group. The top five products are shown with a sixth group for all other products combined. The category crude oil and bitumen is in the top five products each year, and takes the top spot in many of the years examined. In 1990 it was the fifth-ranked product, accounting for 3.6% of total exports, and in 2019 it was the top-ranked product, accounting for 14.1% of total exports.
Rising investment supports ongoing production and exports.
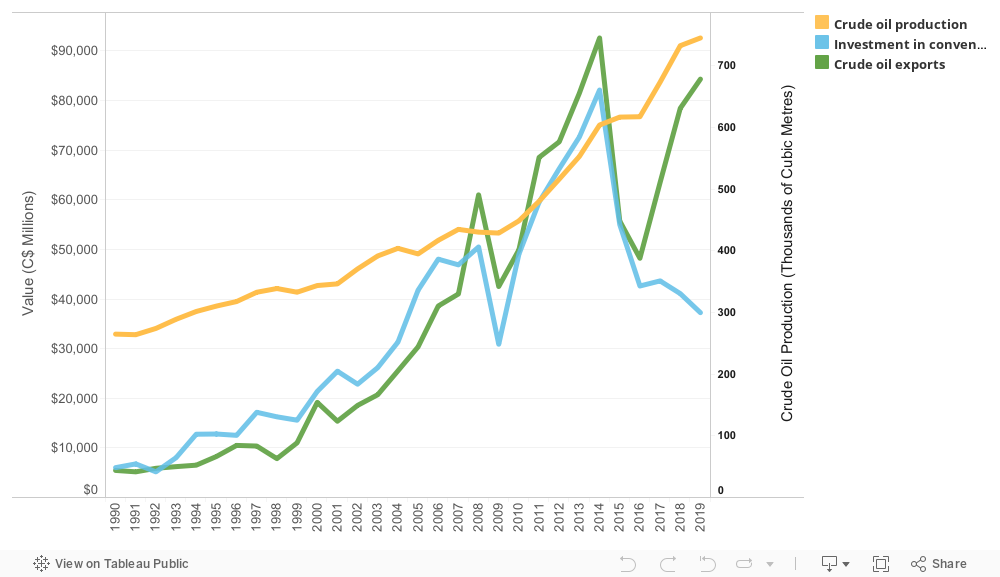
In general, investment in a given project within the oil and gas sector tends to occur in the years preceding production, due in large part to the scale of the project. For most of the previous 30 years, rising investment in oil and gas has helped to support increases in crude oil production volumes and export values. Over time, as technology evolved and oil prices increased, the proportion of investment in oil and gas projects has shifted toward oil sands projects, where assets have a longer lifespan and yield longer returns relative to investment in conventional oil and gas projects.
Following significant reductions in investment and export values in 2015 and 2016 (mainly in response to a steep drop in global crude oil prices), a rebound in export values began in 2017, while investment levels stagnated. Investment decisions in oil and gas can be influenced by factors such as price volatility, access to markets, transportation constraints, production limits, and climate policy. These factors have likely influenced the trend in oil and gas investment observed in recent years. Meanwhile, production volumes and export values have been supported by earlier investment and increasing efficiency from investment dollars spent.
Figure 6. Oil and Gas Investment, Crude Oil Export Value, and Crude Oil Production Volumes
Source and Description
Source: Crude oil export values: Statistics Canada, Table 12-10-0121-01 International merchandise trade by commodity, monthly (x1 000 000). CER Estimated Production of Canadian Crude Oil and Equivalent, Statistics Canada, Table 36-10-0096-01, Flows and stocks of fixed non-residential capital, by industry and type of asset, Canada, provinces and territories (x1 000 000).
Description: The stacked area chart shows the annual value of Canadian crude oil exports and all other exports, in millions of dollars, from 1990 to 2019. Growth in the value of exports of both crude oil and all other exports is evident over the 30 year period, and the share of crude oil exports in total exports increased by 2019.
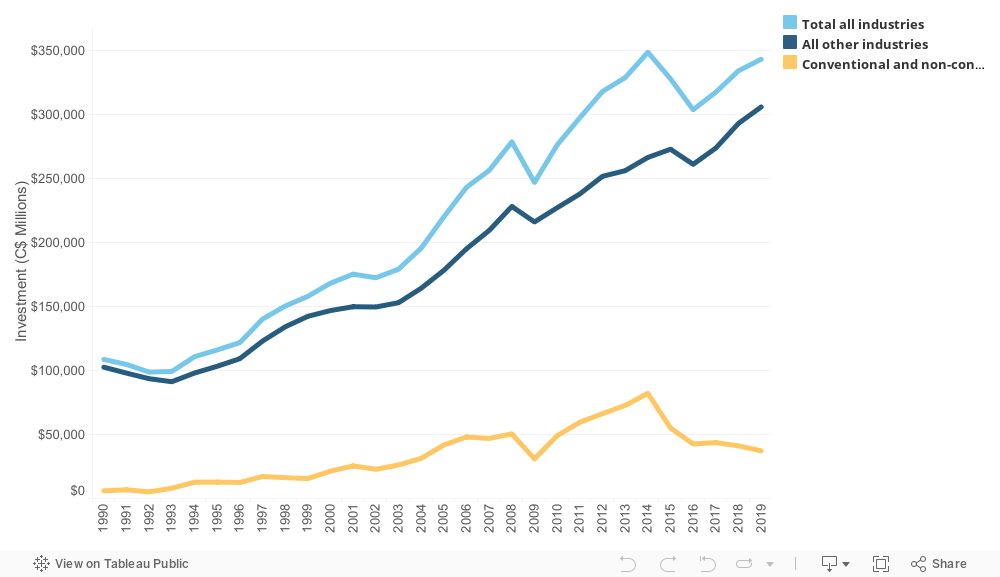
Figure 7. Investment in Oil and Gas vs. Other Industries
Source and Description
Source: Statistics Canada, Table 36-10-0096-01, Flows and stocks of fixed non-residential capital, by industry and type of asset, Canada, provinces and territories (x1 000 000).
Description: The line graph depicts annual Canadian investment in conventional and non-conventional oil and gas, investment in all other industries, and total investment for all industries, from 1990 to 2019, in millions of Canadian dollars. The trends between the three series were similar until 2016 when investment in the total of all industries and in all other industries diverged and did not follow the decline in investment in conventional and non-conventional oil and gas.
Canada’s Trade Balance
Strength in exports of crude oil sustains Canada’s trade balance.

Canada’s merchandise trade balance, measured as the difference between its exports and imports of goods on a balance of payments basis, is strongly influenced by crude oil exports. In addition to being a closely-watched indicator in its own right, the goods trade balance directly influences other high-level economic indicators such as the current account and the balance of international payments. The difference between exports and imports, after accounting for changes in prices, also contributes to the real gross domestic product calculation using the expenditure method.Footnote 5
In the early 1990s, there was relatively little difference between the value of Canada’s exports and imports of crude oil, and so this product had no significant influence on Canada’s merchandise trade balance. Over time, as growth in exports of crude oil accelerated, the impact these exports had on the trade balance became more apparent.
By the 2010s, Canada’s trade balance shifted from structural surpluses to deficits, as Canadian merchandise exports failed to recover as quickly or fully from the global financial crisis as imports did. Still, with strong annual surpluses fueled by sustained high export levels, crude oil helped to moderate the level of the overall deficit, as the balances for other products continued to weaken. Major trend changes in the trade balance for crude oil are evident as well in the overall trade balance during this period.
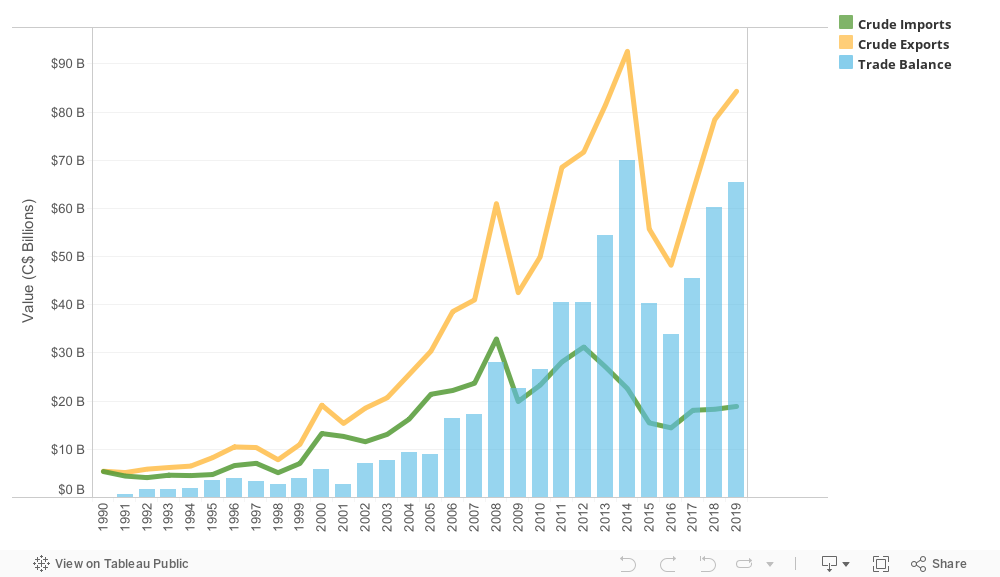
Figure 8. Crude Oil Imports, Exports, and Trade Balance
Source and Description
Source: Statistics Canada, Table 12-10-0121-01 International merchandise trade by commodity, monthly (x1 000 000).
Description: The mixed line and bar chart depicts Canada’s annual imports, exports and trade balance of crude oil from 1990 to 2019. These are shown in billions of Canadian dollars. Imports and exports are presented as lines, and the trade balance is presented as bars. In general, the trade balance widens over time as exports grow steadily, until both peak in 2014. Following declines in 2015 and 2016, exports and the trade balance resume their climb. Imports meanwhile grow at a slower pace and have generally been in a slow decline since peaking in 2012.
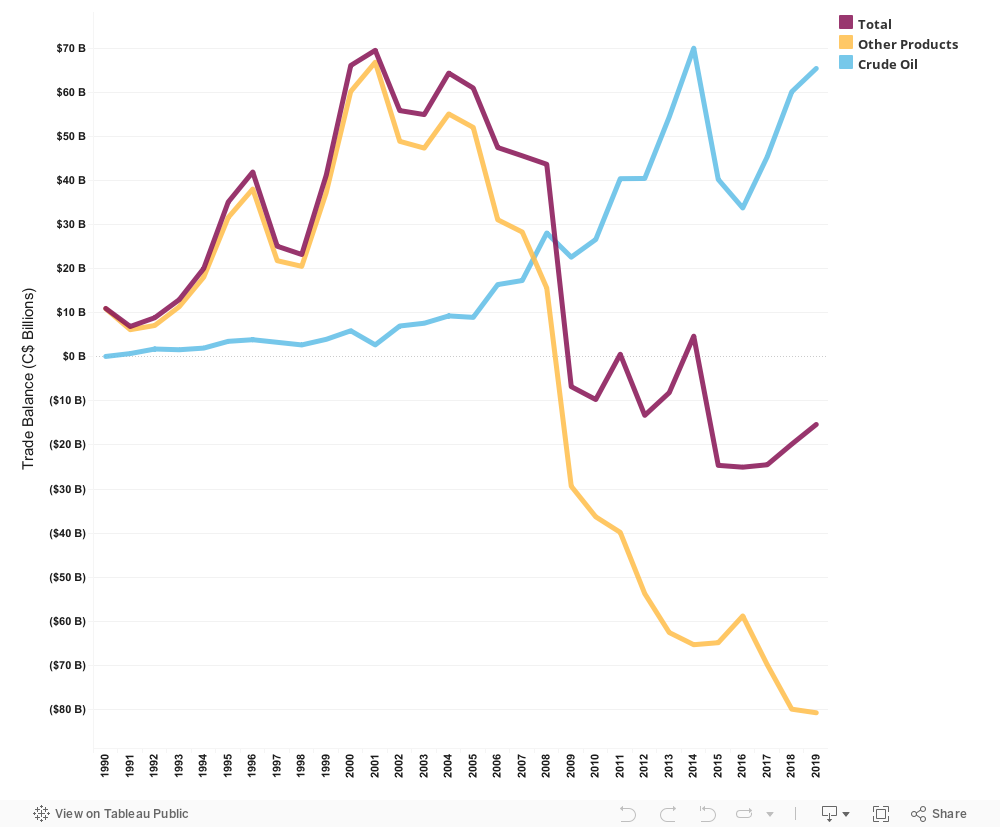
Figure 9. Trade Balance for Crude Oil vs. Other Products
Source and Description
Source: Statistics Canada, Table 12-10-0121-01 International merchandise trade by commodity, monthly (x1 000 000).
Description: The line graph depicts Canada’s annual trade balance for crude oil, the trade balance for all other products, and the total trade balance, from 1990 to 2019. These are shown in billions of Canadian dollars. The graph shows a shift in the total trade balance from a surplus position to a deficit position in 2008. As the trade balance for all other products flipped from surpluses to deficits at that time, the crude oil trade surplus widened over the 30 year period.
Preliminary Look at 2020
The COVID-19 pandemic in 2020 had a substantial impact on Canadian crude oil production and exports.
Crude oil export values declined each month in early 2020 until a low was reached in April ($1.2 billion), a level not seen since 2002. Export values recovered each month thereafter mainly on the strength of rising prices, but had not yet returned to pre-pandemic levels by December. Overall, crude oil export values in 2020 fell 40.1% from the previous year. Exports of crude oil accounted for 9.6% of total export values in 2020, down from 14.1% a year earlier, but remained Canada’s top exported product for the year.
Meanwhile, the decline in crude oil export values contributed to an increase in Canada’s merchandise trade deficit, which more than doubled to reach $37.5 billion in 2020.
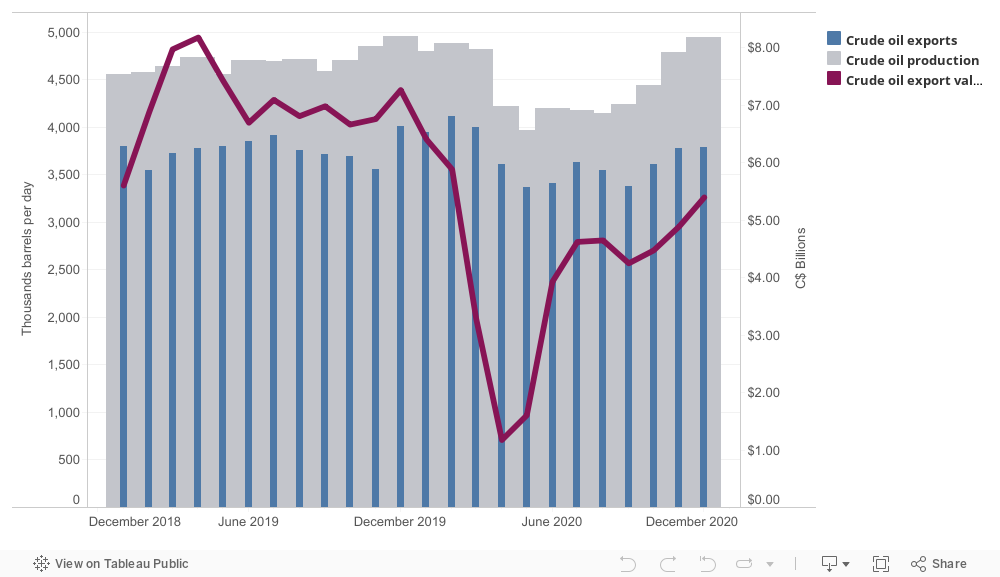
Figure 10. Canadian Crude Oil Production, Exports and Export Value 2019-2020
Source and Description
Source: Crude oil export values: Statistics Canada, Table 12-10-0121-01 International merchandise trade by commodity, monthly (x1 000 000). CER estimated production of Canadian crude oil and equivalent, monthly (millions of barrels per day), CER calculations.
Description: The mixed line and bar chart depicts depicting Canada’s monthly crude oil production, exports and export value from 2019 to 2020. The chart shows crude oil production and export volumes presented as bars, measured in millions of barrels, on the left axis. The export value is presented as a line measured, in billions of dollars, on the right axis. Export value shows a sharp drop between December 2019 and April 2020; crude oil production and export volumes are shown to follow suit, although lagged by a few months. A steady upward trend for all values is evident in the last quarter of 2020.

From March 2020 onward, pandemic-related lockdowns and stay-at-home orders to prevent the spread of the coronavirus directly contributed to sharply lower demand, reduced economic activity, and significant volatility in energy prices. Oil demand was particularly affected because of reduced travel and business activity.
The monthly average price of WTI fell 72% from December 2019 to US$16.50 per barrel in April 2020, the lowest in 21 years. This dramatic fall was driven not only by pandemic-related demand reductions, but also by OPEC+ disagreeing to continue 2.1 million barrels per day of production cuts established in September 2016. This resulted in oversupply to oil markets as demand was sinking. Prices fell so much that global producers, including those in Canada, sharply reduced oil production.
In response to low prices, OPEC+ agreed to cut production by 9.7 million b/d in May 2020, the single largest output cut in history, in order to balance oil markets. Oil prices started recovering in May 2020, in part because of these production cuts and cuts from other countries, like Canada and the U.S., but also because sectors of the world economy began to gradually recover. By the close of 2020, the monthly average WTI price had recovered to US$47.02 per barrel. Canadian production increased in response to the WTI price rebound. Overall, following a decade of growth, Canadian production of crude oil in 2020 was down 4.5% in 2020 to 4.5 million b/d, the lowest level since 2018.
The uncertainty in the industry also had an impact on investments. The International Energy Agency reported that global upstream investment for 2020 totaled only one third of the amount planned at the start of the year.
For most of the past three decades, Canada’s crude oil sector has evolved substantially and crude oil has consistently remained one of Canada’s most important products in terms of export value and trade balance. Global demand and prices, geopolitical events, climate change, technology, and now the COVID-19 pandemic, are a few of the factors that have had significant impacts on the Canadian crude oil sector. The CER and Statistics Canada will continue to monitor and report on Canadian energy systems to keep Canadians informed of the latest developments in this key industry.
Access the Data Used In this Report
The data aggregated and created for this report are available as open datasets for download on Open Government.
Appendix
The crude oil data used in this report come from a number of different sources from both the CER and Statistics Canada. Naturally, there are some differences in each department’s data. For conceptual and analytical purposes, there is alignment in the definition of crude oil used throughout this report. For a thorough comparison of the various data sets listed below, please see Reconciling Canada Energy Regulator and Statistics Canada Crude Oil Export Data.
- Commodity Tracking System
- Canadian International Merchandise Trade (CIMT) – customs basis: CIMT database and data tables 12-10-0121, 12-10-0122, 12-10-0125, 12-10-0126, and 12-10-0128
- Canadian International Merchandise Trade (CIMT) – balance of payments (BOP) basis: data tables 12-10-0121, 12-10-0122, 12-10-0125, 12-10-0126, and 12-10-0128
- Supply and Disposition Crude Oil and Equivalent (Table 25-10-0063-01)
CER provides definitions of its oil categories definitions in the CER Glossary.
The products discussed in the export value analysis above are defined using the North American Product Classification System (NAPCS 2017, Version 1.0) at the NAPCS group level.
Within investment data, industries are defined using the North American Industry Classification System (NAICS 2017, Version 2.0).
Export data by NAPCS Group are available in Statistics Canada Table 12-10-0121-01. Figures cited above are expressed on a balance of payments basis.
Investment data by NAPCS category are available in Statistics Canada Table 36-10-0096-01. Figures cited above represent an aggregation of categories Conventional oil and gas extraction and Non-conventional oil extraction. Data are expressed in current prices.
Statistics Canada’s Supply and Disposition Crude Oil and Equivalent, Table 25-10-0063-01, does make a distinction between crude produced “in the field” and what is produced “synthetically”, by upgrading heavy crude bitumen. Overall, crude oil production includes heavy, light and medium, crude bitumen and synthetic crude.
Monthly average WTI prices were taken from the Energy Information Administration’s (Spot Prices Crude Oil and Petroleum Products). The monthly average is calculated by the Administration from its daily data by taking an unweighted average of the daily closing spot prices over the specified time period.
- Date modified: