Canada Energy Regulator – 2020–21 Departmental Results Report – Analysis of trends in spending and human resources
Actual expenditures
Departmental spending trend graph
The following graph presents planned (voted and statutory spending) over time.
Graphic description
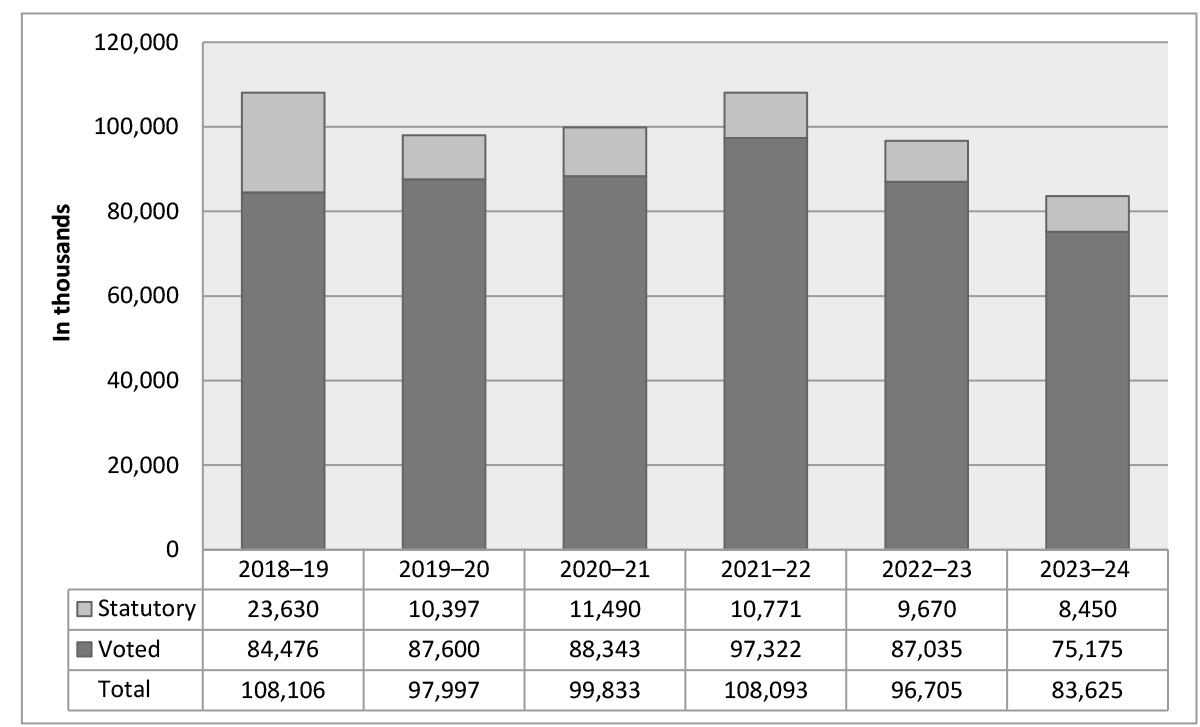
Departmental Spending 2018–19 to 2023–24
This bar chart shows the Canada Energy Regulator’s six-year (voted and statutory) spending trend.
2018–19 Statutory (in thousands): 23,630
2018–19 Voted (in thousands): 84,476
2018–19 Total (in thousands): 108,106
2019–20 Statutory (in thousands): 10,397
2019–20 Voted (in thousands): 87,600
2019–20 Total (in thousands): 97,997
2020–21 Statutory (in thousands): 11,490
2020–21 Voted (in thousands): 88,343
2020–21 Total (in thousands): 99,833
2021–22 Statutory (in thousands): 10,771
2021–22 Voted (in thousands): 97,322
2021–22 Total (in thousand)s: 108,093
2022–23 Statutory (in thousands): 9,670
2022–23 Voted (in thousands): 87,035
2022–23 Total (in thousands): 96,705
2023–24 Statutory (in thousands): 8,450
2023–24 Voted (in thousands): 75,175
2023–24 Total (in thousands): 83,625
The CER is funded through Parliamentary appropriations. The Government of Canada currently recovers approximately 99% of the appropriation from the industry the CER regulates. All collections from cost recovery invoices are deposited to the account of the Receiver General for Canada and credited to the Consolidated Revenue Fund.
Pipeline and power line companies that hold authorizations under the Canadian Energy Regulator Act are subject to cost recovery. Applications before the CER for new facilities are not subject to cost recovery until the facility is placed into service, unless the company does not have any prior facilities regulated by the CER in which case a one-time levy is assessed following the authorization of construction.
Cost recovery is carried out on a calendar year basis.
Budgetary performance summary for Core Responsibilities and Internal Services (dollars)
Core responsibilities and Internal Services |
2020–21 |
2020–21 |
2021–22 |
2022–23 |
2020–21 |
2018–19 |
2019–20 |
2020–21 |
|---|---|---|---|---|---|---|---|---|
Energy Adjudication |
19,870,310 |
19,870,310 |
19,419,562 |
18,914,053 |
22,100,126 |
23,372,250 |
21,550,144 |
20,864,381 |
Safety and Environment Oversight |
17,875,000 |
17,875,000 |
25,473,425 |
24,081,579 |
29,060,400 |
22,648,545 |
24,588,408 |
23,152,134 |
Energy Information |
4,459,939 |
4,459,939 |
8,112,706 |
5,335,109 |
6,457,741 |
9,554,137 |
9,235,424 |
5,934,378 |
Engagement |
7,898,891 |
7,898,891 |
10,789,048 |
9,958,236 |
12,711,040 |
5,811,773 |
7,611,046 |
9,611,208 |
Subtotal |
50,104,140 |
50,104,140 |
63,794,741 |
58,288,977 |
70,329,307 |
61,386,705 |
62,985,022 |
59,562,101 |
Internal Services |
29,445,190 |
29,445,190 |
44,298,450 |
38,415,591 |
37,875,705 |
32,009,262 |
35,011,968 |
39,028,902 |
Internal Services |
– |
– |
– |
– |
– |
14,710,000 |
– |
1,241,925 |
Total |
79,549,330 |
79,549,330 |
108,093,191 |
96,704,568 |
108,205,012 |
108,105,967 |
97,996,990 |
99,832,928 |
Variance between 2018–19 Actual spending and 2019–20 Actual spending
The 2019–20 actual spending is $10.11 million lower than the 2018–19 actual spending is primarily due to:
- an increase of $2.35 million related to Budget 2019 CER transition cost;
- an increase of $9.19 million mainly related to Budget 2018 transition to new impact assessment and regulatory processes;
- a decrease of $14.71 million related to a levy remission to Northern Gateway Pipelines Limited Partnership;
- a decrease of $4.51 million related to TMX Project reconsideration; and,
- a net decrease of $2.03 million related to compensation adjustments made to terms and conditions of service or employment of the federal public administration.
Variance between 2019–20 Actual spending and 2020–21 Actual spending
The 2020–21 actual spending is $1.84 million higher than the 2019–20 actual spending is primarily due to:
- a decrease of $2.33 million related to Transportation as a result of restriction of COVID-19;
- an increase of $1.24 million related to remission to Vector Pipeline Limited Partnership;
- an increase of $1.0 million mainly related to SAP implementation project; and,
- a net increase of $1.93 million related to information and technology hardware updates.
Variance between 2020–21 Planned spending and 2020–21 Actual spending
The 2020–21 actual spending is $20.28 million higher than the 2020–21 planned spending is primarily due to:
- an increase of $3.75 million related to operational budget carry-forward; and,
- a net increase of $16.53 million mainly related to funding to stabilize the Canadian Energy Regulator’s operations and improve its ability to interpret and make data available digitally to Canadians.
Variance between 2020–21 Total authorities available for use and 2020–21 Actual Spending
The 2020–21 actual spending is $8.37 million lower than the 2020–21 total authorities is primarily due to:
- a decrease of $2.4 million travel expenses primarily related to the restriction of the COVID-19 pandemic;
- a decrease of $3.9 million related to Budget 2018 transition to new impact assessment and regulatory processes;
- a decrease of $0.7 million in funding to improve its ability to interpret and make data available digitally to Canadians; and
- a net decrease of $1.37 million mainly related to compensation allocation as a result of adjustments made to terms and conditions of service or employment of the federal public administration adjustment.
Variance between 2020–21 Total authorities available for use and 2020–21 Planned spending
The 2020–21 total authorities available for use is $28.66 million higher than the 2020–21 Main Estimates primarily due to:
- an increase of $3.75 million related to operating budget carry forward from 2019–20 to 2020–21;
- an increase of $0.38 million related to compensation allocation as a result of adjustments made to terms and conditions of service or employment of the federal public administration;
- an increase of $25.07 million mainly related to funding to stabilize CER’s operations, and improve its ability to interpret and make data available digitally to Canadians;
- an increase of $1.24 million related to a remission of a total sum paid to Vector Pipeline Partnership; and,
- a decrease of $1.78 million related to 2020–21 employee benefit plan.
Variance between 2021–22 Planned Spending and 2020–21 Planned spending
The 2021–22 planned spending is $28.54 million higher than the 2020–21 planned spending is primarily due to:
- an increase of $29.54 million mainly related to funding to stabilize CER’s operations, and improve its ability to interpret and make data available digitally to Canadians;
- a decrease of $2.23 million related to 2020–21 employee benefit plan; and,
- an increase of $1.24 million related to compensation allocation as a result of adjustments made to terms and conditions of service or employment of the federal public administration.
Variance between 2022–23 Planned Spending and 2021–22 Planned spending
The 2022–23 planned spending is $11.39 million lower than the 2021–22 planned spending primarily due to:
- a decrease of $1.76 million related to Budget 2017 Indigenous Advisory and Monitoring Committees;
- a decrease of $1.0 million related to Budget 2018 transition to new impact assessment and regulatory processes;
- a decrease of $7.53 million in funding make data available digitally to Canadians; and,
- a net decrease of $1.1 million related to compensation adjustments made to terms and conditions of service or employment of the federal public administration.
2020–21 Budgetary actual gross spending summary (dollars)
Core responsibilities and Internal Services |
2020–21 |
2020–21 |
2020–21 |
|---|---|---|---|
Energy Adjudication |
20,864,381 |
– |
20,864,381 |
Safety and Environment Oversight |
23,152,134 |
– |
23,152,134 |
Energy Information |
5,934,378 |
– |
5,934,378 |
Engagement |
9,611,208 |
– |
9,611,208 |
Subtotal |
59,562,101 |
– |
59,562,101 |
Internal Services |
40,270,827 |
– |
40,270,827 |
Total |
99,832,928 |
– |
99,832,928 |
Actual Human Resources
Human resources summary for core responsibilities and Internal Services
Core responsibilities and Internal Services |
2018–19 |
2019–20 |
2020–21 |
2020–21 |
2021–22 |
2022–23 |
|---|---|---|---|---|---|---|
Energy Adjudication |
103.9 |
119.2 |
108.20 |
129.43 |
107 |
103.5 |
Safety and Environment Oversight |
120.2 |
131.0 |
114.00 |
142.46 |
144.5 |
133.5 |
Energy Information |
47.8 |
43.8 |
29.00 |
30.43 |
54.4 |
32.4 |
Engagement |
34.0 |
37.8 |
39.30 |
56.86 |
47.6 |
43.6 |
Subtotal |
305.9 |
331.8 |
290.50 |
359.18 |
353.5 |
313 |
Internal Services |
170.6 |
162.2 |
162.50 |
162.44 |
191.5 |
173.5 |
Total |
476.5 |
494.0 |
453.00 |
521.62 |
545 |
486.5 |
Vvariance between 2018–19 Actual full-time equivalents and 2019–20 Actual full-time equivalents
The increase of 17.5 full-time equivalents from 2018–19 actual to the 2019–20 actual is due to funding related to Budget 2018 Transition to New Impact Assessment and Regulatory Processes to assist the organization in implementing the transition to the Canada Energy Regulator.
Variance between 2020–21 Actual full-time equivalents and 2020–21 Planned full-time equivalents
The increase of 68.78 full-time equivalents from 2020–21 actual to the 2020–21 planned is mainly due to funding related to the Stabilize the Canadian Energy Regulator’s Operations and Data and Information Innovation Initiative.
Variance between 2021–22 Planned full-time equivalents and 2022–23 Planned full-time equivalents
The decrease of 58.5 full-time equivalents from 2021–22 planned full-time equivalents to 2022–23 planned full-time equivalents is mainly attributed to the following:
- a decrease of 10 full-time equivalents related to Budget 2017 Indigenous Advisory and Monitoring Committee;
- a decrease of 6 full-time equivalents related to Budget 2018 Transition to New Impact Assessment and Regulatory Processes;
- a decrease of 30 full-time equivalents related to the Data and Information Innovation Initiative; and,
- a decrease of 12.5 full-time equivalents related to changes in funding levels.
Expenditures by vote
For information on the CER’s organizational voted and statutory expenditures, consult the Public Accounts of Canada 2020–2021.Footnote 38
Government of Canada spending and activities
Information on the alignment of the CER’s spending with the Government of Canada’s spending and activities is available in GC InfoBase.Footnote 39
Financial statements and financial statements highlights
Financial statements
The CER’s financial statements (unaudited) for the year ended March 31, 2021, are available on the departmental websiteFootnote 40.
Financial statement highlights
Condensed Statement of Operations (audited) for the year ended March 31, 2021 (dollars)
Financial information |
2020–21 |
2020–21 |
2019–20 |
Difference |
Difference |
|---|---|---|---|---|---|
Total expenses |
96,794,722 |
115,678,025 |
117,383,336 |
18,883,303 |
(1,705,311) |
Total revenues |
– |
– |
– |
– |
– |
Net cost of operations before government funding and transfers |
96,794,722 |
115,678,025 |
117,383,336 |
18,883,303 |
(1,705,311) |
The actual net cost of operations before government funding and transfers in 2020–21 was $18.88 million higher than the planned results for the same fiscal year. The net increase is primarily due to the Stabilize the Canadian Energy Regulator’s Operations and Data and Information Innovation Initiative.
The actual net cost of operations before government funding and transfers in 2020–21 was $1.5 million lower than the actual results for the previous fiscal year. The net decrease is mainly due to:
- a decrease of $2.4 million travel expenses primarily related to the restriction of the COVID-19 pandemic; and,
- a net increase of $0.9 million professional services primarily related to the SAP implementation project, and information and technology hardware updates.
Condensed Statement of Financial Position (audited) as of March 31, 2021 (dollars)
Financial information |
2020–21 |
2019–20 |
Difference |
|---|---|---|---|
Total net liabilities |
30,801,754 |
27,221,392 |
3,580,362 |
Total net financial assets |
17,666,410 |
15,718,933 |
1,947,477 |
Departmental net debt |
13,135,344 |
11,502,459 |
1,632,885 |
Total non-financial assets |
14,020,372 |
15,294,728 |
(1,274,356) |
Departmental net financial position |
885,028 |
3,791,269 |
(2,907,241) |
- Date modified: