Canada Energy Regulator – Employment Equity Report 2020–2021
Employment Equity Report 2020–2021 [PDF 655 KB]
ISSN 2563-7088

Table of Contents
2. Initiatives to Enhance Equity, Diversity and Inclusion
- 2.1 Corporate Governance and Accountability
- 2.2 Pandemic Response
- 2.3 Reimagining Our Workplace
- 2.4 Data and Analytics
- 2.5 Strengthening and Expanding Networks
- 2.6 Partnerships
- 2.7 Training, Awareness and Development
- 2.8 Human Resources Practices and Supports
- 5.1 Senior Managers
- 5.2 Middle Managers
- 5.3 Professionals
- 5.4 Semi-Professionals & Technicians
- 5.5 Supervisors
- 5.6 Administrative & Senior Clerical
- 5.7 Clerical Personnel
- 5.8 Intermediate Sales & Service Personnel
- 5.9 Semi-Skilled Manual Workers
- 5.10 Summary
6. Analysis of the Numbers of Employee Hires, Promotions and Regrettable Departures
- Annex A: Workforce Availability by Employment Equity Group
- Annex B: Employment Equity, Diversity and Inclusion Plan for 2021-2024
- Annex C: Employment Equity Numerical Goals for 2021-2024
1. General Overview
1.1 The Canada Energy Regulator
The Canada Energy Regulator’s (CER) mission is regulating infrastructure to ensure the safe and efficient delivery of energy to Canada and the world. Our vision is to be an energy regulator with an exemplary workforce that has the confidence of Canadians; is dedicated to ensuring safety and environmental sustainability; builds strong relationships with First Nations, the Métis, and the Inuit; and enhances Canada’s global competitiveness.
The CER understands that to remain a leading regulator, it needs to embed diversity and inclusion into every aspect of its work — from governance to engagement. Changing demographics, shifting environmental and social expectations, rapid advances in technology and communications all require that the CER tap into varied perspectives to tackle complex issues and come up with innovative solutions.
Having a workforce that reflects the citizens it serves contributes to equity, leads to better policy outcomes founded in a deeper understanding of the needs of diverse communities, encourages diversity of thought and perspective, and builds trust in the organization.
A diversity of identities and ideas also helps form more well-rounded views of issues and risks and leads to better and more innovative decisions. That means fostering a culture where engaged and committed employees feel secure in bringing their full selves to work, working respectfully with each other in an environment that encourages diversity of thought as a key element to fostering innovation and supporting personal and professional development.
1.2 Employment Equity and Reporting
To align the CER’s demographics with those of Canada’s labour market, and the Canadians it represents, we seek to enhance human resources practices, create diversity and inclusion initiatives and ensure opportunities are inclusive and barrier-free.
The CER is committed to upholding the legislative requirements of the Public Service Employment Act and the Employment Equity Act. Although this report is focused on the four (4) designated employment equity groups ([1] Women, [2] Aboriginal PeoplesFootnote 1 , [3] Visible Minorities and [4] Persons with Disabilities), the CER is equally committed to providing an inclusive workplace for all its employees.
This report provides the results achieved during the reporting period April 1, 2020 to March 31, 2021.Footnote 2 The Employment Equity, Diversity and Inclusion Plan for 2021-2024 in Annex B an overview of key commitments, measures and targets to bridge gaps and adapt to our workplace to better respond to the needs of all groups.
2. Initiatives to Enhance Equity, Diversity and Inclusion
2.1 Women
The CER, under the direction and oversight of the Board of Directors and with the advice of the Indigenous Advisory Committee, has given prominence to Employment Equity, Diversity, Inclusion, and Belongingness in two of our four Strategic Priorities in our newly-released Strategic Plan: Trust & Confidence and Reconciliation.
We want to ensure both that CER employees share their knowledge and experience openly and transparently, and that our workforce is representative of the diversity of the Canadian population. A diverse workforce will allow us to capitalize on broader perspectives and expertise to improve how we work as a regulator.
We are working towards Reconciliation by transforming the way we work with the Indigenous peoples of Canada, with a commitment to implementing the United Nations Declaration on the Rights of Indigenous Peoples, by enhancing involvement in how we recognize their unique cultures, knowledge and histories; building renewed relationships based on the recognition of rights, respect, co-operation and partnership; improving the cultural competency of the CER and its staff; and driving meaningful change in the CER’s requirements and expectations of regulated industry.
In December 2020, we formed the Indigenous Relations and Reconciliation Business Unit, dedicated to supporting a renewed approach to working with Indigenous Peoples and communities. In the same year, we established an Indigenous Advisory Committee to advise our Board of Directors and supported the establishment of our Indigenous Employee Circle, and are currently working to finalize our first Indigenous Employee Recruitment, Retention and Advancement Strategy.
When Ian Shugart, Clerk of the Privy Council and Secretary to the Cabinet, issued the Call to Action on Anti-Racism, Equity and Inclusion in the Federal Public Service (Clerk’s Call), it helped to further clarify the path we need to follow and aligned with work we have underway. The Clerk’s Call noted the urgency of removing systemic racism and discrimination from the Public Service and the need for concrete actions.
Our senior leadership has focused on ensuring that we have the right foundations to support long-term, sustainable change. The Clerk’s Call emphasized the importance of true inclusion, enabling grassroots networks and communities within the Public Service, and the need to inform actions with an awareness of the interconnected dimensions of identity.
The Clerk asks for meaningful changes and acknowledges that without taking the time to develop them inclusively, our collective success will be hindered. For the CER, we are working to gain a full and honest account of the specific barriers to equity and inclusion faced by those marginalized within our organization. Once people are assured that their voices are being safely heard, we can then move to specific actions to remove those barriers.
In March 2021, our CEO announced the creation of the Diversity & Belonging (D&B) Team. Reporting to the CEO, the Team provides advice on policies and communications, supports employee-led committees to amplify their work, and coordinates events and awareness training.
The Team has also been tasked to work with external experts to develop an organization-wide Roadmap that will set out integrated recommendations and key measures for improving inclusion and equality within the CER by addressing issues such as like systemic racism, cultural barriers, gender-based discrimination, supports for Indigenous employees, and issues faced by persons with disabilities.
Transformational change takes concerted effort and significant resources at the best of times and we are moving in the right direction. We are proud to report on our early progress, but we do so with humility, recognizing the significant distance we have yet to travel, the time it will take to ensure our efforts result in meaningful progress, and that we run the risk of perpetuating exclusion and alienation if we race too quickly to celebrate our successes.
Looking ahead to 2021-2022
- New CER-wide accountabilities for all leaders
- Establishment of Diversity and Belonging roadmap
- Enhanced representation of equity groups on advisory committees
2.2 Pandemic Response
As part of our pandemic response, we conducted a GBA+ assessment of our supports and return-to-office plans. Some of the adjustments made to better meet the needs of our workforce included:
- Guidance to leaders to account for unique challenges and circumstances of certain employee groups, including Indigenous employees, in exercising their management flexibility (e.g., flexible work hours, COVID-19 Leave with pay options);
- Promotion of cultural awareness event series on the disproportionate negative effects of COVID-19, including a virtual national conference discussing the negative effects of the pandemic on racialized communities, religious minorities and Indigenous Peoples;
- A smudge ceremony of Calgary headquarters in August 2020. This was held as a result of internal consultation with Indigenous Employee Circle members who had expressed a desire to cleanse and purify the space before initial office re-entry; and
- Nurse Help Line available 24/7 to all staff, which is Indigenous-owned and has expertise in deserving racialized, Indigenous and at-risk populations.
We also took time this year to implement new physical changes in our Calgary headquarters and to make physical improvements to respond to needs of our workforce and external stakeholders, including:
- A new smudge room to accommodate ceremonial and spiritual practices of our Indigenous employees and Indigenous peoples participating in our hearings;
- Optical access buttons for all washrooms and reception doors to improve accessibility; and
- A gender neutral, fully accessible washroom and change room.
2.3 Reimagining Our Workplace
Reimagining our workplace post-pandemic offers challenges and opportunities. For some individuals, remote work offered new flexibility for their families and better accommodation of disabilities. For others, it exacerbated mental health issues arising from isolation and anxieties. Some reported relief from micro-aggressions, while others reported fears that remote work may negatively impact their career development.
As we navigate the next phase, we plan to incorporate what we have learned and find an approach that prioritizes both employee well-being and enhanced efficiency. In launching our reflection on the future of our workplace, we conducted a GBA+ assessment by engaging with different employee groups, administering a survey, and reviewing best-practices on flexible work arrangements. Findings confirmed for us the potential for adapting to a more inclusive, reimagined workplace. For instance, we found that:
- Women employees indicated a significant preference for greater flexibility around work hours, in part to address caregiving responsibilities;
- Indigenous employees placed a higher value on flexibility overall, including to nurture their connection to communities and the land, and for supporting extended families; and
- Employees with physical disabilities indicated a significant preference for remote work options to address mobility and accessibility challenges.
We now look forward to launching a six-month hybrid pilot program as we adapt to a more inclusive workplace emerging from the pandemic. Our planning takes into consideration implementing the Accessible Canada Act, as we look to meet our commitments more fully for employees and our colleagues who live with disabilities.
Looking ahead to 2021-2022
- Launch of principles-based hybrid workplace pilot
- Implementation plan for new Accessibility Canada Act
2.4 Data and Analytics
Over the period, the CER expanded its use of analytical and visualization capabilities to unpack the Public Service Employee Survey (PSES) 2020 results. We found gaps between equity and non-equity employee groups in many themes, including experiences of harassment and discrimination, job satisfaction, accommodations for disabilities and trust in leadership. These findings support continuous improvement and targeted actions to adapt our people and workplace practices to bridge the gaps and make our workplace better for all CER employees.
Over the year, the CER focused its self-identification efforts by working closely with Treasury Board Secretariat on the new government-wide survey to be launched in late 2022. We recognized that not all employees have self-identified or/and may be comfortable to do so. We look forward in working with our employee groups and leaders to address potential apprehension as we promote the new TBS questionnaire.
Looking ahead to 2021-2022
- New TBS self-identification campaign proving disaggregated data
- Use of PSES data as key corporate performance metrics on equity, diversity, inclusion and belongingness
2.5 Strengthening and Expanding Networks
Several employee-led groups support the formation of a more diverse and inclusive workplace. These groups also help the organization to better understand its needs, the issues it faces, and systemic barriers that could affect the CER’s ability to attract, engage and retain top talent.
Our employee committees are voluntary, and employees contribute to them alongside their day-to-day work to deliver on our mandate. Involvement ranges from monthly or bimonthly meetings to more intensive duties associated with leading groups, planning and hosting events, and providing input to the CER on items for consultation. In 2020-2021, there were more than 14 Corporate Citizenship initiatives at the CER including ones highlighted below.
Diversity & Inclusion Committee (30 members)
The CER’s Diversity & Inclusion Committee (D&IC) continued to attract new volunteer members, increasing membership from 22 to 30 since last fiscal year. Almost every CER job level and business unit is represented within the group in five subcommittees: Cross-Cultural Communication, Employment Equity & Diversity Plan, Indigenous, LGBTQ2+, Persons with Disabilities, and Systemic Bias.
Women’s Leadership Community of Practice (129 members)
In late 2020-2021, our Women’s Leadership Community of Practice (WLCOP) produced a summary report on gender discrimination, highlighting individual employee experiences and suggesting a path to addressing instances of discrimination.
Our CEO shared the report with all employees and announced the standing up of the Project Task Force to address gender discrimination at the CER, led by one of our most senior executives. The task force has since developed a detailed action plan to examine and implement the recommendations made in the Summary Report.
Indigenous Employee Circle (20 members)
The Indigenous Employee Circle is meant to be a safe space for self-identifying Indigenous employees to gather. As part of Reconciliation, the CER is looking at how to recognize, encourage and utilize an Indigenous lens to transform our organization and the way we work. Indigenous employees are a key part of this transformation, and the Circle is a key place for them to meet, network, collaborate and share their perspectives and insights on the organization.
Indigenous Awareness Project Working Group (10 members)
The Indigenous Awareness Project Working Group and Indigenous Relations and Reconciliation Business Unit have hosted 21 internal events with high-caliber presenters representing the diversity of Indigenous peoples across Canada, including:
- Michèle Audette, Commissioner, National Inquiry on Missing & Murdered Indigenous Women and Girls (MMIWG);
- Alberta Regional Chief Marlene Poitras and Yukon Regional Chief Kluane Adamek, Women in Leadership, Politics and the Assembly of First Nations (AFN); and
- Murray Sinclair, former member of the Canadian Senate, Orange Shirt Day: Honoring Residential School Survivors.
Black Employees Network (25 members)
The Black Employee Network is a new addition to our Corporate Citizenship roster. In March 2021, they participated in the organization of a well-attended panel with Black Executives in the Canadian Public Service.
GBA+ Community of Practice (32 members)
Promotion of the development and sharing of best practice in GBA+ assessment in support of our Core Responsibilities and programs.
Catalysts for Change (55 members)
The Catalysts are a determined group of CER employees and leaders working together to strengthen the organization. They provoke change across the organization and act on employee inputs and forums with special attention to the People and Workforce Supports.
Mental Health Committee (25 members)
The CER's Mental Health Committee's role is to assist with implementing Mental Health Strategy initiatives and to focus on raising awareness, engagement of CER employees.
Collectif franco (10 members)
Collectif franco is a cultural group that aims to promote the use of French through exchanges intended to facilitate the retention of previously acquired knowledge for native-born Francophones and/or language learning for those whose mother tongue is not French.
Data Feminism (16 members)
The purpose of the Data Feminism group is to critically discuss aspects of the CER’s data collection, analysis, use, and communication that relate to cultural and human issues such as justice, equity, objectivity, algorithmic bias, and GBA+. Data Feminism is about how bias reveals itself in data and how we can work to change that.
Looking ahead to 2021-2022
- Launch of new Corporate Citizenship TIME code and accountabilities
- Pilot programs to better support groups in planning, funding and promoting events
2.6 Partnerships
We partner with organizations to improve how we work and deliver our mandate. These partnerships also allow our workforce gain cultural competency and build networks. In 2020-2021, we continue to work closely with Indigenous Advisory and Monitoring Committees and worked with Crown-Indigenous Relations and Northern Affairs Canada to deliver Positive Space workshops.
Indigenous Monitoring Advisory Committees
Indigenous peoples, the Government of Canada, and the CER worked together to create the Indigenous Advisory and Monitoring Committees, or IAMCs. We are a member of two IAMCs: one for the Trans Mountain Expansion Project (TMEP) and one for the Enbridge Line 3 Replacement Program (Line 3).The IAMCs have generated many opportunities for our organization to advance our relationship with Indigenous peoples, including:
- IAMC Indigenous Monitors;
- Indigenous cultural training for CER Inspectors;
- Inspection regime informed by Indigenous Knowledge (e.g., about local fauna and flora);
- Indigenous participation in field deployment activities (e.g., emergency response); and
- Ongoing communications with Indigenous communities along the pipeline route.
Crown-Indigenous Relations and Northern Affairs Canada (CIRNAC)
In 2020-2021, the CER and CIRNAC partnered to offer Positive Space workshops facilitated by CIRNAC to CER employees. The multi-day workshops were developed to include an Indigenous lens, and informed participants about the benefits and methods of creating Positive Spaces within organizations, recognizing and addressing micro-aggressions in the workplace, and ways to become an Ally.
2.7 Training, Awareness and Development
In 2020-2021, the CER rolled out a series of mandatory training courses on Unconscious Bias to all staff. The training shone a light on personal biases and how these biases impact our personal behavior. It also provided the foundation for further work to create more fair recruitment and retention processes, enhance the inclusivity of our organization, and to be truly representative of all Canadians.
The CER also initiated workshops on Advancing Racial Equity and Inclusive Leadership, to increase knowledge, skills, and awareness of best practices to uncover unconscious biases, how to be anti-racist, and lead more inclusively, and develop an action plan for participants to apply their learning towards advancing racial justice.
Awareness of cultural and unconscious biases are important steps in understanding Indigenous Peoples and building a respectful workplace to better serve the Canadian public. The following cultural competency and unconscious bias trainings were implemented:
| Course Name | Attendees |
|---|---|
| Reflecting on Cultural Bias: Indigenous Perspectives (Note 1) | 492 |
| Understanding Unconscious Bias | 495 |
| Employment Equity under the Employment Equity Act (Note 2) | 49 |
| Bridging the Diversity Gap (Note 2) | 54 |
| Advanced Indigenous Cultural Competency Training (Note 3) | 22 |
| Workplace Culture Workshop: Leading Inclusively and Advancing Racial Equality | 185 |
Note 1: Mandatory training for all employees |
|
The CER continues to offer an online orientation course which includes an Employment Equity component to all new hires.
In alignment with the new Harassment and Violence Prevention regulations, a new CER Workplace Harassment and Violence Prevention policy was rolled out to provide clarity about the types of behavior acceptable in our workplace, expanding to include instances of domestic violence that occur in the workplace. Mandatory training for all staff and leaders is provided.
Looking ahead to 2021-2022
- New TBS self-identification campaign proving disaggregated data
- Use of PSES data as key corporate performance metrics on equity, diversity, inclusion and belongingness
2.8 Human Resources Practices and Supports
The CER ‘s Human Resources Team led work on developing a cultural competence framework to help inform all hiring, promotion and performance management. They are also jointly working with the Indigenous Employee Circle to build the CER’s first Indigenous Recruitment and Retention Report.
The CER also focused efforts to recruit students of racialized communities. Human Resources worked proactively with post-secondary institutions to identify high potential candidates for summer internships, developing targeted hiring programs through co-op programs and government of Canada programs, and offering training, mentoring and/or coaching for these student employees.
Looking ahead to 2021-2022
- Improvements to Employee and Family Assistance Program to better meet the needs of a diverse workforce
- GBA+ review of key HR policies, including on Accommodations
3. Workforce Analysis
3.1 Data Sources
The CER uses MyGCHR 9.1, one of the Government of Canada’s standardized Human Resources Management Systems. Only those who voluntarily identify as Aboriginal People, Visible Minorities or Persons with Disabilities are captured as members of designated groups for the purpose of conducting the workforce analysis. Women are identified using the gender information they provide via their hiring documents which is entered into MyGCHR by Human Resources.
Like most other federal government departments and agencies, it is believed that the existing self-ID data is not a current reflection of the actual numbers, especially for Visible Minorities and Persons with Disabilities. Representation numbers for these two groups in this report are likely understated. Treasury Board of Canada Secretariat’s (TBS) “Employment Equity Modernization of Self-ID Project” is expected to result in more current data for next fiscal year.
Additionally, the CER is exploring a more robust form of extracting and analyzing Employment Equity data during the year using differing projections to ensure our plan is more dynamic. This could result in next year’s report seeing a rise in the number of gaps, giving us a clearer picture on the true state of the CER’s Employment Equity landscape.
Workforce Availability for the four designated Employment Equity groups is determined by federal government census data. TBS has confirmed the use of 2016 census data for this 2020-2021 fiscal year report. Per the census data, the workforce population is considered those aged 15 years and older.
Since the vast majority of the CER’s employees work in Calgary, either Calgary or provincial workforce availability data is used for Women, Aboriginal Peoples, and Visible Minorities obtained from Employment and Social Development Canada’s report on Canada’s 2016 Census. However, for the Senior Managers, Middle and Other Managers and Professionals occupational groups, national data is used.
We also use national workforce availability data for Persons with Disabilities obtained from Canada’s 2016 Participation and Activity Limitation Survey, because this survey does not have Calgary-specific details.3.2 Employee Population
The workforce analysis was conducted on the total employee population with the exception of individuals who work less than 12.5 hours/week. In addition, the following persons were not included in the CER workforce analysis:
- Governor-in-Council appointments: CEO and Commissioners;
- Members of the Board of Directors;
- Persons who are at the CER on Interchange from other Federal Government departments/agencies and private industry;
- Persons who worked for a period less than thirteen weeks;
- Students;
- Casuals; and
- Contractors.
3.3 Analysis
An analysis of representation levels of designated groups within the CER was conducted and conclusions are detailed below. It is important to note that, due to our relatively small workforce, a change of one or two individuals within a designated group can change percentages significantly.
Employment equity representation is determined by comparing the representation within an occupational group with its workforce availability. To ensure confidentiality for the designated employment equity group employees, the tables presented in this report do not indicate any numbers where representation is three (3) or less, with the exception of Women. This is referred to as “residual disclosure”. Please note that some tables include the number of men to ensure data is accurate.
4. Overall Representation
An analysis of the total employee population was conducted and the results by gender and designated group members are shown in Table 1. As of March 31, 2021, the CER had 549 employees. Table 1 below shows the representation by designated groups compared with the labour market availability data. Due to CER’s relatively low number of employees, the detailed breakdown resulted in having to blank out most of the designated group results due to representation having been three (3) or less.
From these comparisons, we observe that:
- Women: Exceeds workforce availability by 16.7%
- Aboriginal Peoples: Exceeds workforce availability
- Visible Minorities: Falls short of workforce availability
- Persons with Disabilities: Falls short of workforce availability
Table 1: Comparison of Total Employee Population with Availability Data (as of March 31, 2021)
| Number of Employees | Men | Women | Aboriginal Peoples | Visible Minorities | Persons with Disabilities** | |
|---|---|---|---|---|---|---|
| Total | 549 | 201 | 348 | * | * | * |
| CER Representation | 36.6% | 63.4% | ** | ** | ** | |
| 2016 Census Availability Data | 49.4% | 46.7% | 2.4% | 24.8% | 8.8% | |
| Variance | -12.8% | 16.7% | *** | *** | *** | |
Note 1: The groups above will not add up to the total # of employees as an employee may belong to more than one group. Note 2: Of the CER’s 549 employees, 524 (95.4%) are full-time and 25 (4.6%) are part-time. Note 3: Comparisons throughout this report are percentage point differentials, as they are across the federal government. For example, Table 1 shows CER’s representation of Aboriginal Peoples is 4.0% compared to 2.4% availability, resulting in CER being 1.6% or 1.6 percentage points higher than availability. Persons with Disabilities is 3.3% compared to availability of 8.8%, therefore 5.5% or 5.5 percentage points lower than availability. Viewed from a different perspective, CER’s representation of Aboriginal Peoples is almost two times more than availability, whereas our representation of Persons with Disabilities is almost two and a half times less than availability. |
||||||
4.1 Women
Men comprised 36.6% (201) of the total population. Women comprised 63.4% (348), which is a marginal increase from last year’s number of 334 as shown in Chart 1.
Chart 1: Employment Equity Representation: Women - 2014 to 2021
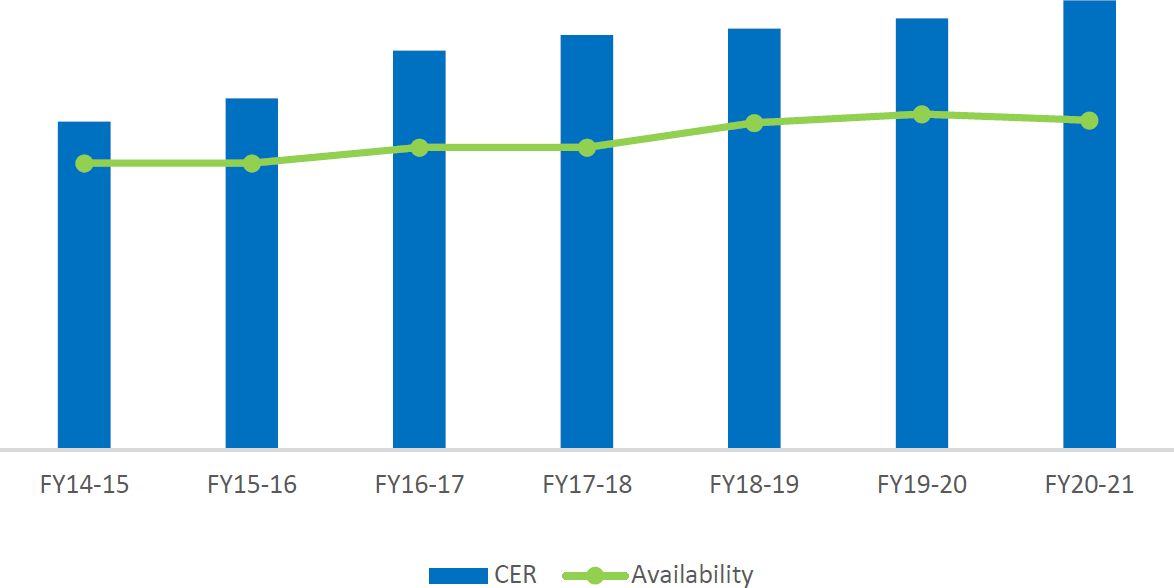
Graphic description
This bar chart compares the Canada Energy Regulator's (CER's) number of Women employees to Canada's workforce availability of Women for the fiscal years 2014/15, 2015/16, 2016/17, 2017/18, 2018/19, 2019/20 and 2020/21.
2014/15 CER: 254
2014/15 Canada: 222
2015/16 CER: 272
2015/16 Canada: 222
2016/17 CER: 309
2016/17 Canada: 234
2017/18 CER: 321
2017/18 Canada: 234
2018/19 CER: 326
2018/19 Canada: 253
2019/20 CER: 334
2019/20 Canada: 260
2020/21 CER: 348
2020/21 Canada: 255
4.2 Aboriginal Peoples
Aboriginal Peoples decreased during the previous year as shown in Chart 2.
Chart 2: Employment Equity Representation: Aboriginal Peoples - 2014 to 2021
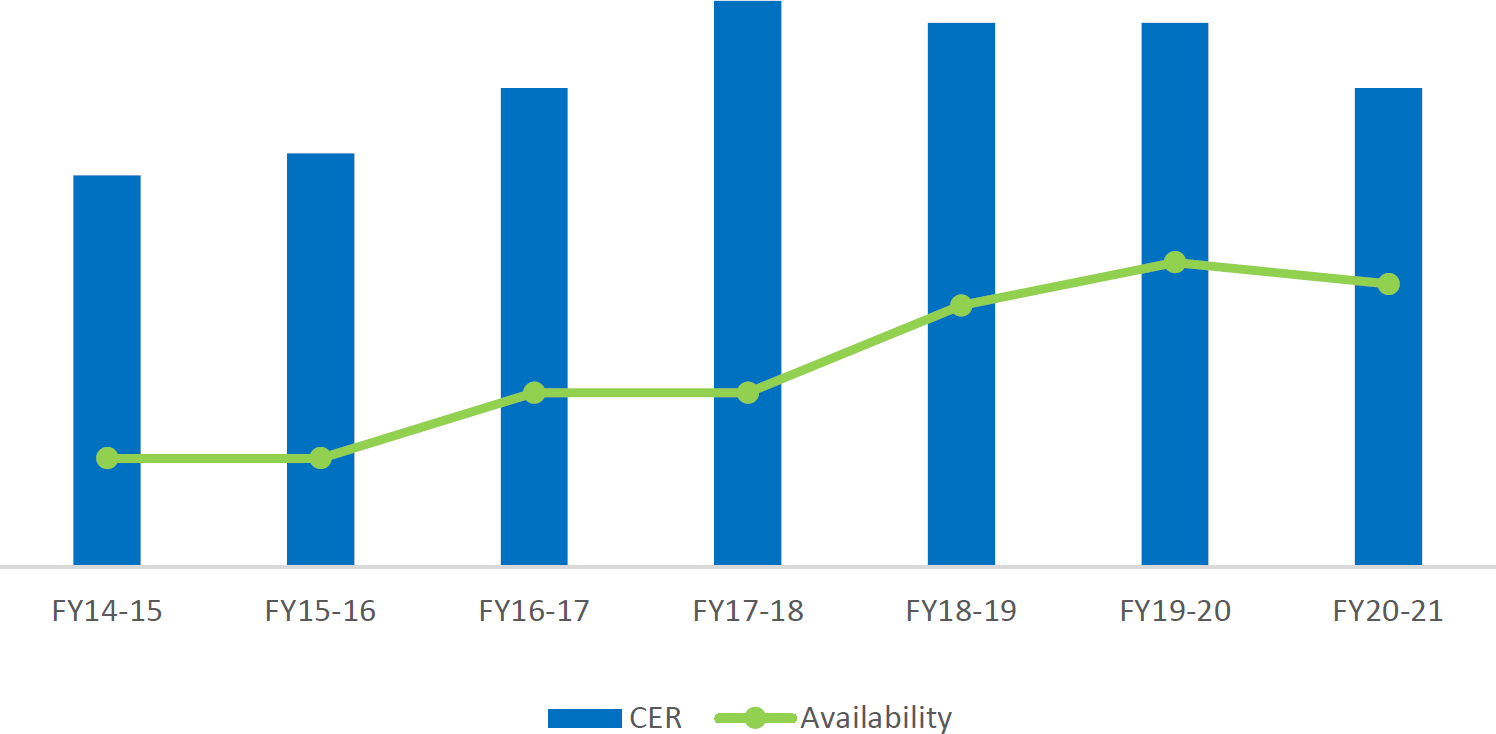
Graphic description
This bar chart compares the Canada Energy Regulator's (CER's) number of Aboriginal employees to Canada's workforce availability of Aboriginals for the fiscal years 2014/15, 2015/16, 2016/17, 2017/18, 2018/19, 2019/20 and 2020/21.
2014/15 CER: 18
2014/15 Canada: 5
2015/16 CER: 19
2015/16 Canada: 5
2016/17 CER: 22
2016/17 Canada: 8
2017/18 CER: 26
2017/18 Canada: 8
2018/19 CER: 25
2018/19 Canada: 12
2019/20 CER: 25
2019/20 Canada: 14
2020/21 CER: 22
2020/21 Canada: 13
4.3 Visible Minorities
Visible Minorities increased during the last year as shown in Chart 3.
Chart 3: Employment Equity Representation: Visible Minorities - 2014 to 2021
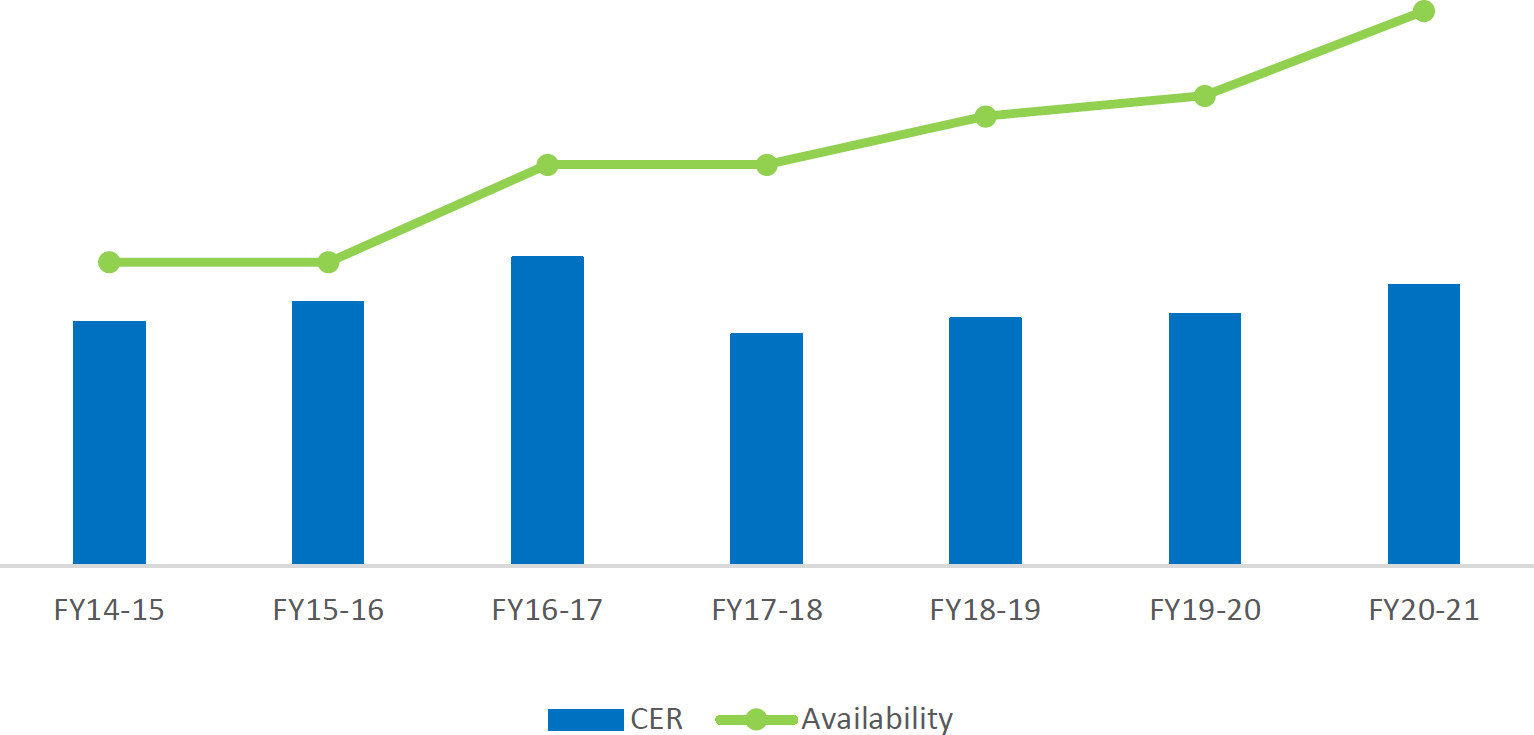
Graphic description
This bar chart compares the Canada Energy Regulator's (CER's) number of Visible Minority employees to Canada's workforce availability of Visible Minorities for the fiscal years 2014/15, 2015/16, 2016/17, 2017/18, 2018/19, 2019/20 and 2020/21.
2014/15 CER: 60
2014/15 Canada: 75
2015/16 CER: 65
2015/16 Canada: 75
2016/17 CER: 76
2016/17 Canada: 99
2017/18 CER: 57
2017/18 Canada: 99
2018/19 CER: 61
2018/19 Canada: 111
2019/20 CER: 62
2019/20 Canada: 116
2020/21 CER: 69
2020/21 Canada: 137
4.4 Persons with Disabilities
Persons with Disabilities decreased marginally during the last year as shown in Chart 4.
Chart 4: Employment Equity Representation: Persons with Disabilities – 2014 to 2021
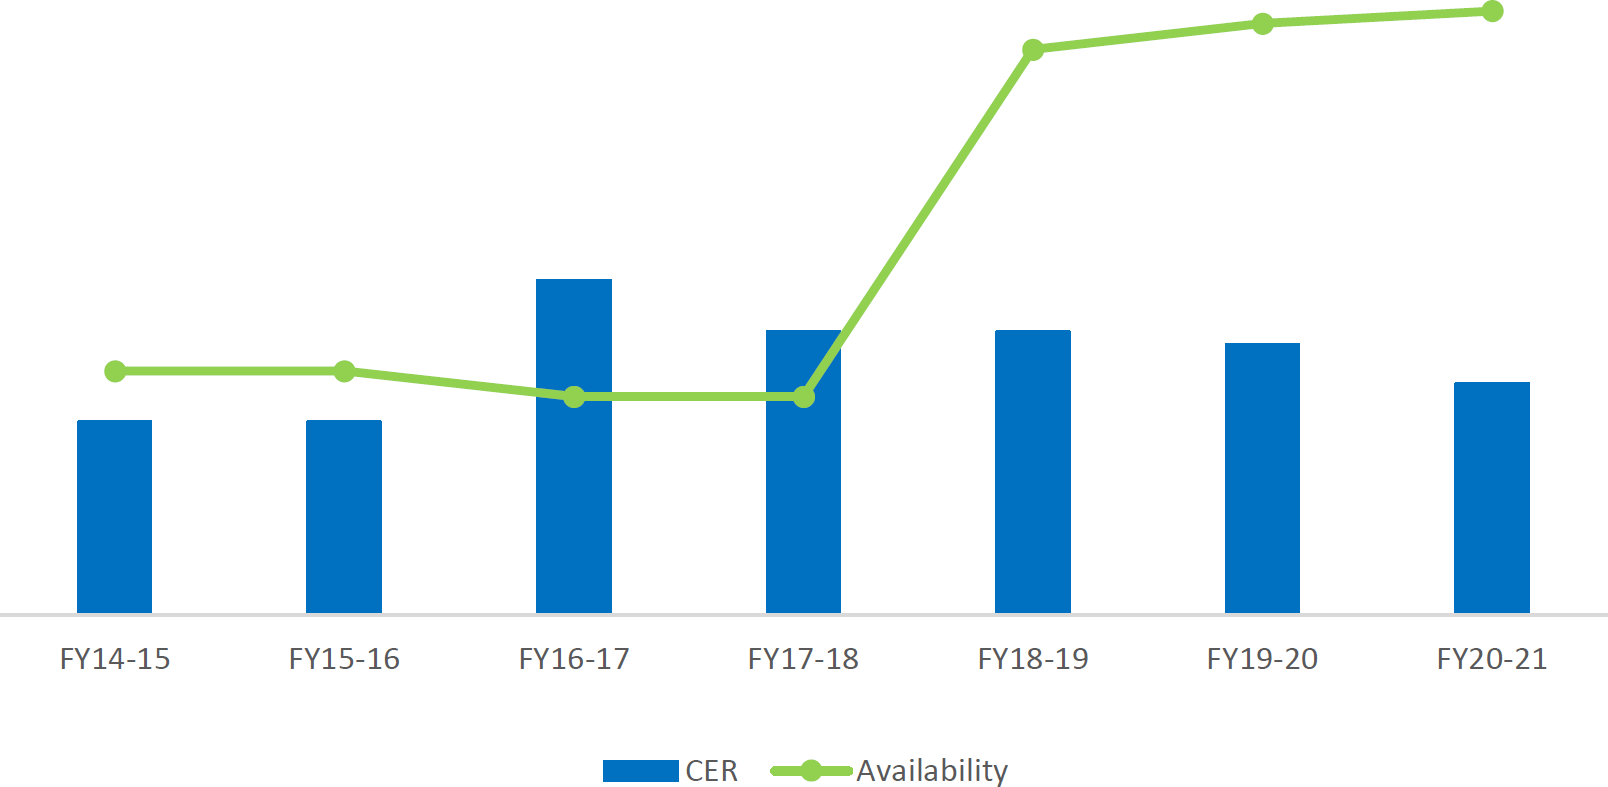
Graphic description
This bar chart compares the Canada Energy Regulator's (CER's) number of Persons with Disabilities employees to Canada's workforce availability of Persons with Disabilities for the fiscal years 2014/15, 2015/16, 2016/17, 2017/18, 2018/19, 2019/20 and 2020/21.
2014/15 CER: 15
2014/15 Canada: 19
2015/16 CER: 15
2015/16 Canada: 19
2016/17 CER: 26
2016/17 Canada: 17
2017/18 CER: 22
2017/18 Canada: 17
2018/19 CER: 22
2018/19 Canada: 44
2019/20 CER: 21
2019/20 Canada: 46
2020/21 CER: 18
2020/21 Canada: 47
5. Occupational Groups
Table 2 shows the breakdown of the total employee population by gender and designated groups into employment equity occupational groups. For each occupational group, the representation by gender and designated group is given in whole numbers, as well as the relevant percentage of the total number of employees. The labour market availability data is the percentage figure that follows.
5.1 Senior Managers
Table 2shows that as of 31 March 2021, there were 16 senior managers employed at the CER. Nine (9) were women, which at 56.3%, is higher than the overall Calgary labour market availability of 27.6%. There was no representation of Aboriginal Peoples in this group. Although representation of Visible Minorities is not specified due to residual disclosure, it was lower than the labour market availability of 11.5%. Representation of Persons with Disabilities is also not specified due to residual disclosure, however it was higher than the labour market availability of 5.0%.
5.2 Middle Managers
There were 33 middle managers, of whom 54.5% were Women compared to market availability of 39.4%. There was no representation of Aboriginal Peoples or Persons with Disabilities. Visible Minority representation increased over last year, now at 12.1% compared to market availability of 17.6%.
5.3 Professionals
The Professionals group is comprised of financial officers, engineers, economists, environmental specialists, human resources advisors, communications advisors, information systems specialists, translators and lawyers. In this group, Women were well-represented (60.0% vs 41.4% availability), as were Aboriginal Peoples (2.6% vs 2.1% availability). Visible Minorities were under-represented (12.3% vs 25.6% availability), as were Persons with Disabilities (2.9% vs 8.9% availability).
5.4 Semi-Professionals & Technicians
The Semi-Professionals and Technicians occupational group includes engineering inspectors, library technicians, information technology service analysts and graphic designers. Women were well-represented in this group (53.8% vs 34.0%), as were Aboriginal Peoples (10.3% vs 3.3%). Specific details for Persons with Disabilities and Visible Minorities are not shown due to residual disclosure. In both cases, they were under-represented compared to availability.
5.5 Supervisors
Of the five employees in this occupational group, four were Women. There was no representation in the other three designated employment equity groups.
5.6 Administrative & Senior Clerical
The Administrative & Senior Clerical occupational group includes business unit administrators, human resources assistants, and other senior level administrative staff. Women were well-represented (91.4% vs 81.2%). Aboriginal Peoples were also higher than the 2.9% market availability, although specific details are not shown due to residual disclosure. Visible Minorities were lower than availability (11.4% vs 20.9%). There was no representation for Persons with Disabilities.
5.7. Clerical Personnel
This category includes records, mail clerks and general administrative assistants. Women were well represented (79.4 % vs 70.7%) as were Aboriginal Peoples (8.8% vs 3.1%). Persons with Disabilities were slightly less than availability (7.4% vs 9.3%), however Visible Minorities were under-represented (22.1% vs 30.6%).
5.8. Intermediate Sales & Service Personnel
There were only two employees within this occupational group, with no representation in any of the four designated employment equity groups.
5.9 Semi-Skilled Workers
There is only one employee within this occupational group, with no representation in any of the four designated employment equity groups.
5.10 Summary
An analysis of occupational groups from an employment equity perspective highlights opportunities for increasing representation in under-represented occupational groups, and maintaining or improving in occupational groups that are well represented already.
Women exceeded market availability in all occupational groups, except for Intermediate Sales & Service Personnel and Semi-Skilled Manual Workers. There were only 3 employees in total within these two groups, none of whom were Women. The most populated occupational groups for CER’s 348 Women were: Professionals (210), Clerical Personnel (54) and Administrative and Senior Clerical (32).
Aboriginal Peoples exceeded market availability in the each of the four occupational groups in which they were represented, namely: Professionals, Semi-Professionals & Technicians, Administrative & Senior Clerical, and Clerical Personnel. There is clear opportunity for improvement in occupational groups where there was no representation, in particular: Senior Managers, Middle Managers and Supervisors.
Visible Minorities fell short of workforce. They were under-represented in the six occupational groups and had no representation within the Supervisors occupational group. This indicates that a more vigorous focus for this employment equity group is warranted.
Persons with Disabilities also fell short of workforce availability. While they exceeded availability in the Senior Managers group and were almost on par with availability in the Semi-Professionals & Technicians and Clerical Personnel groups, they were less than available workforce in all other occupational groups. Additional focus on this employment equity group is also warranted.
TABLE 2: Comparison of Employee Population with Availability Data by Employment Equity Groups and by Occupational Groups (as of March 31, 2021)
| Employment Equity Occupational Group |
Total | Men | Women | Aboriginal Peoples | Visible Minorities | Persons With Disabilities |
|---|---|---|---|---|---|---|
| 01: Senior Managers | 16 | 7 | 9 | 0 | Table Note * | Table Note * |
| CER% : Census% | 43.7% : 72.4% | 56.3% : 27.6% | 0% : 2.7% | Table Note *% : 11.5% | Table Note *% : 5% | |
| 02: Middle Managers | 33 | 15 | 18 | 0 | 4 | 0 |
| CER% : Census% | 47.2% : 60.6% | 54.5% : 39.4% | 0% : 2.7% | 12.1% : 17.6% | 0% : 5% | |
| 03: Professionals | 530 | 140 | 210 | 9 | 43 | 10 |
| CER% : Census% | 40.0% : 58.6% | 60.0% : 41.4% | 2.6% : 2.1% | 12.3% : 25.6% | 2.9% : 8.9% | |
| 04: Semi-Profess. & Technicians | 39 | 18 | 21 | 4 | Table Note * | Table Note * |
| CER% : Census% | 46.2% : 66% | 53.8% : 34% | 10.3% : 3.3% | Table Note *% : 20.3% | Table Note *% %: 7.6% | |
| 05: Supervisors | 5 | 1 | 4 | 0 | 0 | 0 |
| CER% : Census% | 20.0% : 46.2% | 80% : 53.8% | 0% : 3.1% | 0% : 36.7% | 0% : 27.5% | |
| 07: Administrative & Senior Clerical | 35 | 3 | 32 | * | 4 | 0 |
| CER% : Census% | 8.6% : 18.8% | 91.4% : 81.2% | Table Note *% : 2.9% | 11.4% : 20.9% | Table Note *% : 10% | |
| 10: Clerical Personnel | 68 | 14 | 54 | 6 | 15 | 5 |
| CER% : Census% | 20.6% : 29.3% | 79.4% : 70.7% | 8.8% : 3.1% | 22.1% : 30.6% | 7.4% : 9.3% | |
| 11: Intermed. Sales & Service Personnel | 2 | 2 | 0 | 0 | 0 | 0 |
| CER% : Census% | 100% : 32.2% | 0% : 67.8% | 0% : 3.01% | 0% : 37.7% | 0% : 10.8% | |
| 12: Semi-Skilled Manual Workers | 1 | 1 | 0 | 0 | 0 | 0 |
| CER% : Census% | 100% : 85.6% | 0% : 14.4% | 0% : 3.0% | 0% : 40.1% | 0% : 10% | |
| Totals | 549 | 201 | 334 | Table Note * | Table Note * | Table Note * |
|
Note: Occupational Groups will not add up to the totals as employees may belong to more than one designated groups. Note: The #s which precede the Employment Equity Occupational Groups in column 1 are non-sequential numeric codes. |
||||||
6. Analysis of the Numbers of Employee Hires, Promotions and Regrettable Departures
Tables 3, 4 and 5 summarize new employee hires, promotions and departure activity between April 1, 2020 and March 31, 2021.
6.1 Employee Hires
While we were required to redact Table 3 in its entirety due to residual disclosure, most hires were Women and Visible Minorities. None of the new hires self-identified as Aboriginal Peoples.
6.2 Employee Promotions
Though much of the data on Table 4 is not specified due to residual disclosure, there was a more than 100% increase in promotions from last year. It is noteworthy to mention that the CER indicates a substantial increase in promotions this fiscal year due to the completion of Human Resources’ “Classification System Implementation (CSI) initiative”, which saw a significant number of positions reclassified to a higher level.
Like last year, the majority of promotions were among Women and Visible Minorities, with a smaller number occurring among Aboriginal Peoples and Persons with Disabilities.
Table 4: Employee Promotions by Employment Equity Groups and by Occupational Groups (April 1, 2020 to March 31, 2021)
| Employment Equity Occupational Group | Total | Women | Aboriginal Peoples | Visible Minorities | Persons with Disabilities |
|---|---|---|---|---|---|
| 01: Senior Managers | Table Note * | Table Note * | 0 | 0 | 0 | 2020–2021
| 02: Middle Managers | Table Note * | Table Note * | 0 | 0 | 0 | 2020–2021
| 03: Professionals | Table Note * | 38 | 4 | 10 | Table Note * | 2020–2021
| 04: Semi-Professionals & Technicians | 9 | 9 | 0 | 0 | 0 | 2020–2021
| 05: Supervisors | Table Note * | Table Note * | 0 | 0 | 0 | 2020–2021
| 07: Administrative & Senior Clerical Personnel | Table Note * | 11 | Table Note * | 5 | 0 | 2020–2021
| 10: Clerical Personnel | Table Note * | 36 | Table Note * | 9 | Table Note * | 2020–2021
| Total | 131 | 98 | 7 | 24 | 5 | 2020–2021
|
Note: Occupational Groups will not add up to the totals as employees may belong to more than one designated groups. Note: The #s which precede the Employment Equity Occupational Groups in column 1 are non-sequential numeric codes. |
|||||
6.3 Employee Departures
Though much of the data on Table 5 is not specified due to residual disclosure, of the employees who left the CER during this period, the majority were Women. There were no departures among Visible Minorities. As in past reports, these departures occurred primarily in the Professionals occupational group.
Table 5: Employee Departures by Employment Equity Groups and by Occupational Groups (April 1, 2020 to March 31, 2021)
| Employment Equity Occupational Group | Total | Women | Aboriginal Peoples | Visible Minorities | Persons with Disabilities |
|---|---|---|---|---|---|
| 01: Senior Managers | 0 | 0 | 0 | 0 | 0 |
| 02: Middle Managers | Table Note * | Table Note * | 0 | 0 | 0 |
| 03: Professionals | Table Note * | Table Note * | Table Note * | 0 | Table Note * |
| 04: Semi-Professionals &Technicians | 0 | 0 | 0 | 0 | 0 |
| 05: Supervisors | 0 | 0 | 0 | 0 | 0 |
| 07: Administrative & Senior Clerical Personnel | 0 | 0 | 0 | 0 | 0 |
| 10: Clerical Personnel | Table Note * | Table Note * | 0 | 0 | 0 |
| Total | Table Note * | Table Note * | Table Note * | 0 | * |
|
Note: Occupational Groups will not add up to the totals as employees may belong to more than one designated groups. Note: The #s which precede the Employment Equity Occupational Groups in column 1 are non-sequential numeric codes. |
|||||
7. Conclusion and Way Forward
As in past reports, the CER’s overall workforce exceeds representation among Women and Aboriginal Peoples, and is under-represented among Visible Minorities and Persons with Disabilities. However, as outlined in our Strategic Plan priorities and the CER’s response to the Call to Action on Anti-Racism, Equity, and Inclusion in the Federal Public Service, we are dedicated to do better for all of our equity deserving groups (EDG) by fostering feelings of inclusion, belongingness, and reconciliation in our organization.
The following are key additional initiatives to not only increase representation of our underrepresented groups, but to help these groups feel included, valued, and heard at the CER.
First, the Diversity and Belonging Team is planning specific engagement sessions employee-led communities. We will also be sending out an organization-wide survey to gauge competency related to diversity and belonging and to help determine the appropriate scoping of issues and priorities.
Second, we are responding to the joint directive from the Public Service Commission and TBS regarding the ongoing implementation of Nothing Without Us: An Accessibility Strategy for the Public Service. Specifically, the CER will continue to make a priority the improvement of the recruitment, retention and promotion of persons with disabilities to close gaps in representation by 2025.
Additionally, our Employment Equity, Diversity and Inclusion (EEDI) 2021-2024 Plan outlines the various commitments, measures, targets, and responsibilities to thoroughly respond to employment equity legislative requirements.
For instance, over the next three years, we have committed to ensuring accurate self-identification data collection (e.g., via a modernized online self-identification form), prioritizing positive employment equity practices (e.g., communicating work opportunities through innovative means to increase visibility with EDG), and striving to reach specified recruitment goals for EDG.
In conclusion, with our action-oriented initiatives and our hearts in the right place, this Employment Equity Report serves as a reminder for our continued dedication to a diverse, inclusive, and equitable workplace.
Annex A: Workforce Availability by Employment Equity Group
Table 6: Workforce Availability – Women (as of March 31, 2021)
| Employment Equity Occupational Group | All Employees | Representation | Availability | Gap | ||
|---|---|---|---|---|---|---|
| # | # | % | % | # | # | |
| 01: Senior Managers | 16 | 9 | 56.3% | 27.6% | 4 | +5 |
| 02: Middle Managers | 33 | 18 | 54.5% | 39.4% | 13 | +5 |
| 03: Professionals | 350 | 210 | 60.0% | 41.4% | 145 | +65 |
| 04: Semi-Professionals & Technicians | 39 | 21 | 53.8% | 34.0% | 13 | +8 |
| 05: Supervisors | 5 | 4 | 80.0% | 53.8% | 3 | +1 |
| 07: Administrative & Senior Clerical Personnel | 35 | 32 | 91.4% | 81.2% | 28 | +4 |
| 10: Clerical Personnel | 68 | 54 | 79.4% | 70.7% | 48 | +6 |
| 11: Intermediate Sales & Service Personnel | 2 | 0 | 0% | 67.8% | 1 | -1 |
| 12: Semi-Skilled Worker | 1 | 0 | 0% | 14.4% | 0 | 0 |
| Total | 549 | 348 | 63.4% | 46.7% | 256 | +93 |
* Representation is three (3) or less. Note: Occupational Groups will not add up to the totals as employees may belong to more than one designated groups Note: The #s which precede the Employment Equity Occupational Groups in column 1 are non-sequential numeric codes. |
||||||
Table 7: Workforce Availability – Aboriginal Peoples (as of March 31, 2021)
| Employment Equity Occupational Group | All Employees | Representation | Availability | Gap | ||
|---|---|---|---|---|---|---|
| # | # | % | % | # | # | |
| 01: Senior Managers | 16 | 0 | 0% | 3.2% | 1 | -1 |
| 02: Middle Managers | 33 | 0 | 0% | 2.7% | 1 | -1 |
| 03: Professionals | 350 | 9 | 2.6% | 2.1% | 7 | +2 |
| 04: Semi-Professionals & Technicians | 39 | 4 | 10.3% | 3.3% | 1 | +3 |
| 05: Supervisors | 5 | 0 | 0% | 3.1% | 0 | 0 |
| 07: Administrative & Senior Clerical Personnel | 35 | Table Note * | Table Note *% | 2.9% | 1 | Table Note * |
| 10: Clerical Personnel | 68 | 6 | 8.8% | 3.1% | 2 | +4 |
| 11: Intermediate Sales & Service Personnel | 2 | 0 | 0% | 0% | 0 | 0 |
| 12: Semi-Skilled Manual Workers | 1 | 0 | 0% | 0% | 0 | 0 |
| Total | 549 | Table Note * | Table Note *% | 2.4% | 13 | Table Note * |
|
Note: Occupational Groups will not add up to the totals as employees may belong to more than one designated groups. Note: The #s which precede the Employment Equity Occupational Groups in column 1 are non-sequential numeric codes. |
||||||
Table 8: Workforce Availability – Visible Minorities (as of March 31, 2021)
| Employment Equity Occupational Group | All Employees | Representation | Availability | Gap | ||
|---|---|---|---|---|---|---|
| # | # | % | % | # | # | |
| 01: Senior Managers | 16 | Table Note * | Table Note *% | 11.5% | 2 | Table Note * |
| 02: Middle Managers | 33 | 4 | 12.1% | 17.6% | 6 | -2 |
| 03: Professionals | 350 | 43 | 12.3% | 25.6% | 90 | -47 |
| 04: Semi-Professionals & Technicians | 39 | Table Note * | Table Note *% | 20.3% | 8 | Table Note * |
| 05: Supervisors | 5 | 0 | 0% | 36.7% | 2 | -2 |
| 07: Administrative & Senior Clerical Personnel | 35 | 4 | 11.4% | 20.9% | 7 | -3 |
| 10: Clerical Personnel | 68 | 15 | 22.1% | 30.6% | 21 | -6 |
| 11: Intermediate Sales & Service Personnel | 2 | 0 | 0% | 37.7% | 1 | -1 |
| 12: Semi-Skilled Manual Workers | 1 | 0 | 0% | 40.1% | 0 | 0 |
| Total | 549 | Table Note * | Table Note *% | 24.8% | 137 | Table Note * |
|
Note: Occupational Groups will not add up to the totals as employees may belong to more than one designated groups. Note: The #s which precede the Employment Equity Occupational Groups in column 1 are non-sequential numeric codes. |
||||||
TABLE 9: Workforce Availability – Persons with Disabilities
(as of March 31, 2020)
| Employment Equity Occupational Group | All Employees | Representation | Availability | Gap | ||
|---|---|---|---|---|---|---|
| # | # | % | % | # | # | |
| 01: Senior Managers | 16 | Table Note * | Table Note *% | 5.0% | 1 | Table Note * |
| 02: Middle Managers | 33 | 0 | 0% | 5.0% | 2 | -2 |
| 03: Professionals | 350 | 10 | 2.9% | 8.9% | 31 | -21 |
| 04: Semi-Professionals & Technicians | 39 | Table Note * | Table Note *% | 7.6% | 3 | Table Note * |
| 05: Supervisors | 5 | 0 | 0% | 27.5% | 1 | -1 |
| 07: Administrative & Senior Clerical Personnel | 35 | 0 | 0% | 10.0% | 4 | -4 |
| 10: Clerical Personnel | 68 | 5 | 7.4% | 9.3% | 6 | -1 |
| 11: Intermediate Sales & Service Personnel | 2 | 0 | 0% | 10.8% | 0 | 0 |
| 12: Semi-Skilled Manual Workers | 1 | 0 | 0% | 10.3% | 0 | 0 |
| Total | 549 | Table Note * | Table Note *% | 8.8% | 48 | Table Note * |
|
Note: Occupational Groups will not add up to the totals as employees may belong to more than one designated groups. Note: The #s which precede the Employment Equity Occupational Groups in column 1 are non-sequential numeric codes. |
||||||
Annex B: Employment Equity, Diversity and Inclusion Plan for 2021-2024
Commitments, Measures and Targets
This three-year plan outlines the CER’s commitments, measures and targets to meet employment equity goals and advance diversity and inclusion in the workplace – to correct historical disadvantages, support safe, accessible, and healthy work environments and lead to better program outcomes for those we serve. Monitoring and reporting will be done yearly, and the plan adjusted in consultation with equity-deserving employee groups to reflect progress and learnings.
Where possible, we indicated alignment with our response to the Call to Action on Anti-Racism, Equity, and Inclusion in the Federal Public Service, the 2020/2021 Deputy Minister Commitments on Diversity and Inclusion, as well as internally-focused initiatives driven by the CER’s Strategic Plan, such as Diversity & Belonging Roadmap; Post-Pandemic Workplace Approach and Indigenous Recruitment & Retention Strategy.
| Employment Equity Act legislative requirement | Commitments | Measures | Targets |
|---|---|---|---|
1. Collection of workforce data |
1.1 Ensure all new employees complete self-identification form | Analysis of participation rate at March 31 each year |
80% participation rate |
| 1.2 Encourage existing employees to complete modernized self-identification form in MyGCHRFootnote 3 | Communications plan and activities |
100% activities completed |
|
1.3 Send annual reminder to update profile and intent of data collection |
Annual corporate communication |
One (1) communication per year |
|
2. Workforce analysis
|
2.1 Analyze the representation of designated groups in CER workforce and by aggregated occupational group in annual employment equity report |
Analysis of employment equity data compiled as of March 31 of each year |
Representation of designated groups in CER workforce and by aggregated occupational group at least comparable to workforce availability ratesFootnote 4 |
2.2 Analyze recruitment promotions and departure rates of designated group members in the annual employment equity report. |
Analysis of employment equity data compiled as of March 31 each year |
Recruitment, promotion and job retention rates for designated group members measuredFootnote 6 |
|
2.3 Analyze projected gaps based on historical hiring, retirements and voluntary attrition and pending departmental hiring plans to ensure targets are based on the current data |
Forecast gaps using employment equity data as of March 31 each year; hiring, retirement, voluntary attrition data; previous three years and hiring data from each BU |
Future gaps for designated group members measured |
|
3. Employment systems review |
3.1 Assess the need for an employment systems review. |
Commitment and implementation from Staffing Services (HR Services) |
If the employment systems review identifies issues, intentional strategies established, and action plans updated yearly where necessary |
4. Employment Equity -Positive practices
|
4.1 Review and update people and workplace policies, programs and initiatives support employment equity, diversity and inclusion objectives |
People and workplace policies, programs and initiatives integrate positive practices supporting employment equity, diversity and inclusion – including through Gender-based analysis plusFootnote 8 Equity-deserving groups have representation on internal management and advisory committees and their views are represented at executive tables and horizontal initiativesFootnote 9 |
Policies, programs and initiatives reviewed, prioritized and updated as part of cycle three-year review process People and Workplace Management Committee include five employee groups representing equity-deserving groups 100% of Internal Services Memorandum for CEO Decision capture EDI and GBA+ considerations, including on how the needs and views of equity-deserving employee groups have been addressed (e.g., new contracts, a revised HR policy) 100% of major employee-focused strategic initiatives consider views of equity-deserving groups (e.g., diversity and belonging. post pandemic workplace approach, culture definition and audit) |
4.2 Review staffing guidance, tools, training and practices to support employment equity, diversity and inclusion objectives |
Positive practices supporting employment equity, diversity and inclusion integrated to staffing guidance, tools, training and practices |
75% of new Job descriptions and Statement of Merit Criteria reviewed for plain language |
|
4.3 Recruit members from designated groups for all levels and communicate opportunities through innovative means to increase visibility with equity-deserving employee groups
|
Percentage of applicants (including students and trainees) from equity-deserving groups who applied for a position Percentage of candidates (including students and trainees) from equity-deserving groups hired by the CER Percentage of appointments and promotion of Aboriginal, Visible Minorities and Persons with Disabilities to Management Position (NEB-11 to 16), including through career development and talent managementFootnote 10 |
Representation comparable or exceeds workforce availability rates for applicants, candidates and appointments Intentional recruitment strategies established and reviewed with equity-deserving employee groups |
|
4.4. Review course offerings and leadership development opportunities that relate to employment equity, diversity and inclusion |
Analysis of course offerings to determine whether the CER provides sufficient training on employment equity, diversity and inclusion (e.g., unconscious biases, accommodation, anti-racism, cultural competency) |
Yearly review of curriculum as part of the annual planning process |
|
4.5 Support equity-deserving employee groups, initiatives and eventsFootnote 11 |
Integration into performance management system Number of activities and events held during the fiscal year |
Formalized corporate citizenship accountability and time code A minimum of 10 initiatives and events per fiscal year |
|
4.6 Identify and support career development, leadership development and mentorship of employees belonging to equity-deserving groups |
Number of Indigenous, visible minorities and persons with disabilities participating in leadership development programs (for example, the Executive Leadership Development Program or the Building Black Leaders Initiative) and career development services (for example, official language training)Footnote 12 |
Year over year to meet or exceed targets in Annex C |
|
4.7. Tailor mental health support to meet the needs of equity-deserving groups |
Employee Family and Assistance Program includes culturally sensitive services to meet the needs of equity-deserving groups Elder-in-residence program for Indigenous employees |
In place before March 31, 2022
In place before March 31, 2022 |
|
4.8 Demonstrate Management commitment to employment equity, diversity and inclusionFootnote 13 |
Formalized leadership performance management accountabilities related to equity, diversity and inclusion |
100% of leaders at the EVP, VP, Professional Leader and Director levels have diversity and inclusion related accountabilities. |
|
4.9 Combat racism, discrimination and other barriers to inclusion in the workplace empowering employees to speak up about bias and oppression, and better equipping managers to address these issuesFootnote 14 |
Workshops, events and learning activities anti-racism, discrimination and leading inclusively |
90% staff participate in at least one activity |
|
4.10 Attend Multiculturalism Champions Network meetings to share best practices and lessons learned. |
Number of meetings attended compared with the number held. |
100% participation rate by Diversity and Inclusion Champion and/or designated official |
|
4.11 Adapt our pandemic and post-pandemic physical and digital workspaces to be responsive to the needs of equity-deserving groupsFootnote 18 |
Review of facilities office equipment and digital tools to identify improvements, including to support Accessibility Canada Act implementationFootnote 19 |
Yearly review and strategies established to fill gaps where necessary. |
|
5. Monitoring of progress and review and revision of the plan
|
5.1 Review the triennial employment equity, diversity and inclusion plan |
Follow-up and documentation of the status of commitments |
Yearly review included as part of the annual employment equity report, and revision to plan as necessary |
5.2 Review of PSES results by equity-deserving groups |
Trend analysis to identify persisting inequities in workplace experience between equity-deserving groupsFootnote 20, including on Q21, 32, 40, 45 and 46 and those pertaining to harassment, discrimination and anti-racism |
Yearly analysis performed |
|
6. Communication with employees |
6.1 Discuss and highlight employment equity, diversity and inclusion including important topics such as accessibility and accommodation, within the CER through corporate and senior management communicationsFootnote 23 |
Reference to CER employment equity, diversity and inclusion, including annual report, commitments and targets |
2 communication per year on employment equity plan results |
Communication to employees about activities and events organized by employee-driven groups |
100% of activities and events communicated to employees |
||
7. Consultation and collaboration with employee representatives |
7.1 Consult with the Union Management Consultation Committee (UMCC) and other employee groups on the development and updates to the employment equity, diversity and inclusion plan and any subsequent reportingFootnote 24 |
Agenda item at UMCC meetings when appropriate
|
The UMCC consulted on the development and updates to the employment equity plan every 3 years, any subsequent reporting |
| 8. Record maintenance | 8.1 Maintain confidential records to ensure they are kept in accordance with the Employment Equity Act. | Restricted access to employment equity data in information system | 100% of requests to provide access to employment equity data in the system approved by Director, Integrated Planning and Reporting |
|
8.2 Support for robust reporting with central agencies | Annual reports on implementation of Employment Equity Act, Multiculturalism Act, Accessibility Act, Departmental Results Report, |
100% of reports are supported with strong lines of evidence to demonstrate compliance and organizational efforts |
Annex C: Employment Equity Numerical Goals for 2021-2024
While these goals are based on a single point of data collection, that being March 31, 2021, we are currently working on a more robust method of setting and adjusting goals for future reports. This will be achieved by using historical hiring, retirements and voluntary attrition data, combined with departmental hiring plans, to project future gaps and ensure targeted recruitment efforts are always based on the most accurate projections possible.
| Occupational Group Gap and Position(s) Total Gap: No OVERALL gap | GAP | 3 Year Recruitment Goals 2022-2024 | ||
|---|---|---|---|---|
| 2022 | 2023 | 2024 | ||
Professionals
|
1 | 1 | - | - |
Semi-professionals & Technicians
|
2 | 1 | 1 | - |
Intermediate Sales and Service Personnel
|
1 | - | 1 | - |
| Occupational Group Gap and Position(s) Total Gap: No OVERALL gap | GAP | 3 Year Recruitment Goals 2022-2024 | ||
|---|---|---|---|---|
| 2022 | 2023 | 2024 | ||
Senior Managers
|
1 | - | - | - |
Middle and Other Managers
|
1 | 1 | - | - |
Professionals
|
1 | 1 | - | - |
| Occupational Group Gap and Position(s) Total Gap: * | GAP | 3 Year Recruitment Goals 2022-2024 | ||
|---|---|---|---|---|
| 2022 | 2023 | 2024 | ||
Senior Managers
|
* | 1 | - | - |
Middle and Other Managers
|
2 | 1 | 1 | - |
Professionals
|
47 | 10 | 10 | 10 |
Semi-Professionals and Technicians
|
* | * | 1 | 1 |
Supervisors |
2 | 1 | 1 | - |
Administrative and Senior Clerical Personnel |
3 | 1 | 2 | - |
Clerical Personnel |
6 | 2 | 2 | 2 |
Intermediate Sales and Service Personnel |
1 | 1 | - | - |
| Occupational Group Gap and Position(s) Total Gap: * | GAP | 3 Year Recruitment Goals 2022-2024 | ||
|---|---|---|---|---|
| 2022 | 2023 | 2024 | ||
Managers* |
* | - | 1 | - |
Professionals |
21 | 5 | 5 | 5 |
Semi-Professionals and Technicians |
* | 1 | - | - |
Supervisors |
1 | 1 | - | - |
Administrative and Senior Clerical Personnel |
4 | 2 | 2 | - |
Clerical Personnel |
1 | 1 | - | - |
References
Legislation
- Canadian Charter of Rights and Freedoms
- Canadian Human Rights Act
- Canadian Multiculturalism Act
- Employment Equity Act
- Employment Equity Regulations
- Public Service Employment Act
Reports
- Call to Action on Anti-Racism, Equity, and Inclusion in the Federal Public Service - Privy Council Office - Canada.ca - Canada.ca
- 2020/2021 Deputy Minister Commitments on Diversity and Inclusion
- Building a Diverse and Inclusive Public Service: Final Report of the Joint Union/Management Task Force on Diversity and Inclusion
- Many Voices One Mind: a Pathway to Reconciliation
- Progress Report on Implementation of “Nothing Without Us”: Accessibility Strategy for the Public Service of Canada (2019–20)
- Building a Foundation for Change: Canada’s Anti-Racism Strategy 2019–2022
- Truth and Reconciliation - Calls to Action
- National inquiry into missing and murdered indigenous women and girls Final Report
Government Resources
Videos, Webcasts and Podcasts
- Understanding Anti-Black Racism and How to Be an Ally
- What does my headscarf mean to you – Yassmin Abdel-Magied
- Engagez-moi (en français seulement)
- Brené with Aiko Bethea on Inclusivity at Work: The Heart of Hard Conversations | Brené Brown (brenebrown.com)
Recruitment Options
- You’ve qualified in a pool?
- The Virtual Door to Talent with Disabilities
- Career pathways for Indigenous employees
- Indigenous Student Employment Opportunity
- Employment Opportunity for Students with Disabilities
- Contact your HR Advisor to access pools targeted at diversity groups
Others
- Date modified: