The CER has issued an errata to correct several errors in the report
Scenarios and Assumptions

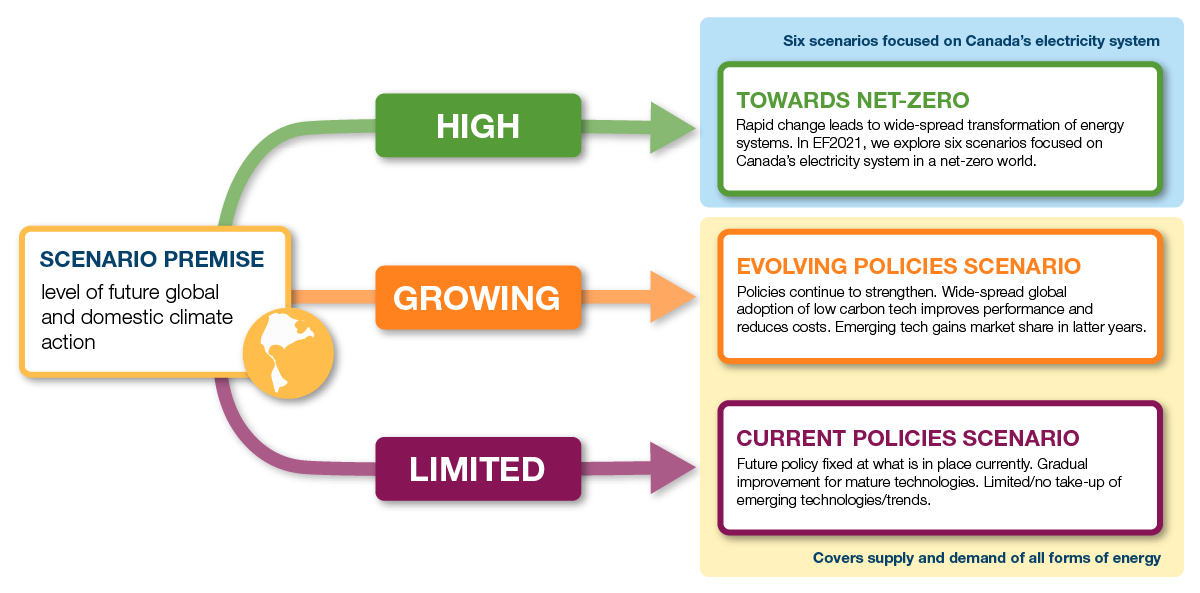
This chapter describes the two core scenarios in EF2021, the Evolving Policies Scenario and the Current Policies Scenario, and the assumptions that underpin those scenarios. The six scenarios, and underpinning assumptions, that explore what achieving net-zero means for Canada’s electricity system are described in the “Towards Net-Zero” section of this report. However, Figure A.1 illustrates the key differences between the two core scenarios and the group of six additional net-zero scenarios that explore the electricity system.
Scenario Premise
EF2021 includes two core scenarios: the Evolving Policies Scenario and the Current Policies Scenario. The central premise to these scenarios is based on the level of future climate action, both globally and domestically. The Evolving and Current Policies scenarios provide projections for all energy commodities and all Canadian provinces and territories.
The primary scenario in EF2021 is the Evolving Policies Scenario. The core premise of the scenario is that action to reduce the GHG intensity of our energy system continues to increase at a pace similar to recent history, in both Canada and the world. Relative to a scenario with less action to reduce GHG emissions, this evolution implies less global demand for fossil fuels, and greater adoption of low-carbon technologies. In contrast, the core premise of the Current Policies Scenario is that there is generally no additional action to reduce GHGs beyond those policies in place today, implying relatively higher global demand for fossil fuels and less adoption of low-carbon technologies. Consistent with these implications, the Evolving Policies Scenario assumes lower international prices for fossil fuels and a higher pace of technological change over the projection period, compared to the Current Policies Scenario.
The Evolving and Current Policies scenarios do not explicitly model climate goals or targets. Given its static policy framework, the Current Policies Scenario is extremely unlikely to lead to the significant GHG reductions needed to meet Canada’s Paris commitments. In the Evolving Policies Scenario, significant GHG emission reductions will be realized, but ambitious goals such as net-zero by 2050 are unlikely to be met.
Figure A.1: Conceptual Illustration of EF2021 Scenarios
Description
Description: This figure provides a conceptual illustration of the scenario premises of EF2021. The first main scenario in EF2021 is the Evolving Policies Scenario. The premise of this scenario is that action to reduce the GHG emissions from our energy system continues to increase at a pace similar to recent history, in both Canada and the world. Relative to a scenario with less action to reduce GHG emissions, this projection implies less global demand for fossil fuels, and greater use of low-carbon technologies. The second main scenario is the Current Policies Scenario, which assumes limited action to reduce GHGs beyond policies in place today. In addition, EF2021 introduces six new scenarios that explore a net-zero future with a high level of global and domestic climate action. Specifically, these scenarios explore what Canada’s electricity grid might look like in a net-zero world under different assumptions about future technologies, climate policies, and electricity use.
The Energy Futures Analytical Process
The analysis in EF2021 follows a three-step process:
- Define the premises of the Scenarios: We develop the scenarios in the Canada’s Energy Future series to explore key uncertainties for the future of the energy system. In EF2021, the primary premise which differentiates the scenarios is the level of global and domestic climate action. We then consider the implications of that premise on factors such as global fossil fuel demand and technology development. These implications are discussed further in this section, under the heading “Scenario Premise.”
- Make explicit assumptions on key inputs: We then make explicit assumptions about key factors which will influence the Canadian energy system. These assumptions are intended to be consistent with the scenario premises defined in Step 1. Key inputs include specific domestic climate policies such as carbon prices, international crude oil and natural gas benchmark prices, and technology cost and performance trends. These are detailed in this section under the heading “Key Assumptions.”
- Develop projections: Given these input assumptions, we develop projections to 2050 using the Energy Futures Modeling System. Results from these projections are included in the following chapters. Additional information about the energy modeling system is included in Appendix 2: Overview of the Energy Futures Modeling System.
Table A.1 summarizes the implications of the core premise of the scenarios across some key areas. It describes how the premise of the Evolving and Current Policies scenarios affects each area, first in a general sense (rows labelled “General Implication”) and then how these translate into explicit assumptions, such as prices or technology costs, included in the EF models (rows labelled “Explicit Assumption Included in EF Modeling”). Many of these areas, such as international markets and technology development, are international in nature. Since EF2021 analysis is focused on Canada, the explicit assumptions, such as market prices and technology cost trends, are developed via a review of global scenario analysis produced by institutions, academia, industry, private forecasters, and other relevant energy analysis.Footnote 3
Table A.1: Explaining the Scenarios and Relationship Between the Assumptions

Description
Description:
| Key Differences Between Scenarios | ||
|---|---|---|
| Evolving Policies | Current Policies | |
| Scenario Premise | ||
| Premise | Continually increasing global and Canadian action to reduce GHG emissions. The pace of increase in future action continues the historical trend. | Global and Canadian action to reduce GHG emissions generally stops at current levels. |
| International Crude Oil Markets | ||
| General Implication | Due to increasing policy action, global crude oil demand is lower than the Current Policies Scenario. | Less policy action leads to higher global crude oil demand compared to the Evolving Policies Scenario. |
| Explicit Assumption Included in EF Modeling | Lower demand implies lower crude oil prices compared to the Current Policies Scenario. Brent crude oil trends gradually downward, reaching $40/bbl 2020USD in 2050. | Stronger demand implies stronger crude oil prices compared to the Evolving Policies Scenario. Brent crude oil averages $70/bbl 2020USD through most of the projection period. |
| International Natural Gas Markets | ||
| General Implication | Due to increasing policy action, global natural gas demand is lower than the Current Policies Scenario. | Less policy action leads to higher global natural gas demand compared to the Evolving Policies Scenario. |
| Explicit Assumption Included in EF Modeling | Henry Hub natural gas prices rise from $3.00/MMbtu 2020 USD in 2021, but at a slower pace than the Current Policies Scenario, reaching $3.64/mmbtu 2020USD in 2050. Canadian liquefied natural gas (LNG) exports increase to 4.9 bcf/d by 2050. | Henry Hub natural gas prices rise faster and higher than in the Evolving Policies Scenario, to $4.40/mmbtu 2020USD in 2050. Canadian LNG exports increase to 7.1 bcf/d by 2050. |
| Low-Carbon Technologies | ||
| General Implication | Increasing policy action drives increasing global adoption of low-carbon technologies, which leads to cost and efficiency improvements as technology advances. | Limited policy action provides a weaker incentive for global technology adoption. Cost declines and performance of low-carbon technologies are weaker compared to the Evolving Policies Scenario |
| Explicit Assumption Included in EF Modeling | Costs for technologies with a growing market share, such as wind and solar power, fall faster compared to the Current Policies Scenario. Emerging technologies are included on a larger scale. Performance of both technology categories improves as compared to the Current Policies Scenario. | Costs continue to improve for technologies where there is a clear trend, such as wind and solar power, but at a slower rate than the Evolving Policies Scenario. Limited inclusion of emerging technologies. |
| Domestic Climate Policies | ||
| General Implication | Policy action continues to increase at the pace of the historical trend. | Policy action is fixed to what is currently in place. |
| Explicit Assumption Included in EF Modeling | A hypothetical suite of future policy changes is assumed. This includes an increase in carbon pricing beyond 2030, tightening of standards for large emitters, a national ZEV mandate, and an increasingly strict emissions intensity mandate for fuels beyond 2030. | Only policies that are law or near-law are included. |
EF2021 is a Baseline for Discussion
It is important to note that the projections presented in EF2021 are a baseline for discussing Canada’s energy future today and do not represent the CER’s predictions of what will take place in the future. EF2021 projections are based on assumptions which allow for analysis of possible outcomes. Any assumptions made about current or future energy infrastructure, market developments, or climate policies, are hypothetical and have no bearing on any regulatory proceeding that is, or will be, before the CER.
Over the projection period, it is likely that developments beyond normal expectations, such as geopolitical events or technological breakthroughs, will occur. Also, new information will become available, and trends, policies, and technologies will continue to evolve. This report is not an official, or definitive, impact analysis of any specific policy initiative, nor does it aim to show how specific goals, such as Canada’s climate targets, will be achieved.
Key Assumptions
Domestic Climate Policy
The Evolving Policies Scenario begins with domestic climate policies currently in place. It then builds on the current policy framework with a hypothetical suite of future policy developments. These policies are chosen to reflect increasing ambition to reduce GHG emissions, and generally align with the broad trends of historical progress. Alternatively, the Current Policies Scenario only includes policies that are currently in place. This section outlines specific policies included, and additional policy detail is available in Appendix 1: Domestic Climate Policy Assumptions.

The Current Policies Scenario includes only policies that currently exist. In the Evolving Policies Scenario, existing policies provide a baseline that is built upon over the projection.
In order to determine whether to include a policy in the analysis, the following criteria were applied:
- The policy was publicly announced prior to 1 August 2021.
- Sufficient details exist to model the policy.Footnote 4
- Goals and targets, including Canada’s international climate targets, are not explicitly modelled. Rather, policies that are announced, and in place, to address those targets are included in the modelling and analysis.
Relative to Canada’s Energy Future 2020 (EF2020), key changes in the Evolving and Current Policies scenarios include the increased carbon pricing included in the Federal Strengthened Climate Plan. The Clean Fuel Standard for liquid fuels has also been included in the Current Policies Scenario, following the publishing of the draft regulations in December 2020.
Future policies:The Evolving Policies Scenario adds a hypothetical suite of future policy developments to existing policies. These policy assumptions take into account several considerations:
- Announced policies that are currently in the development stage are included to the extent possible. Generally, their inclusion requires simplifying assumptions as final regulations are not available.
- Some policies that are being increasingly enacted by various jurisdictions are broadened to other jurisdictions later in the projection period.
- Existing policies that can be strengthened over time, are strengthened. For example, following the carbon price increases to 2030 that are set out in current policy, we include a hypothetical carbon price that continues to rise from 2031 to 2050, as well as a hypothetical tightening of the benchmarks for large emitters subject to the output-based pricing system.
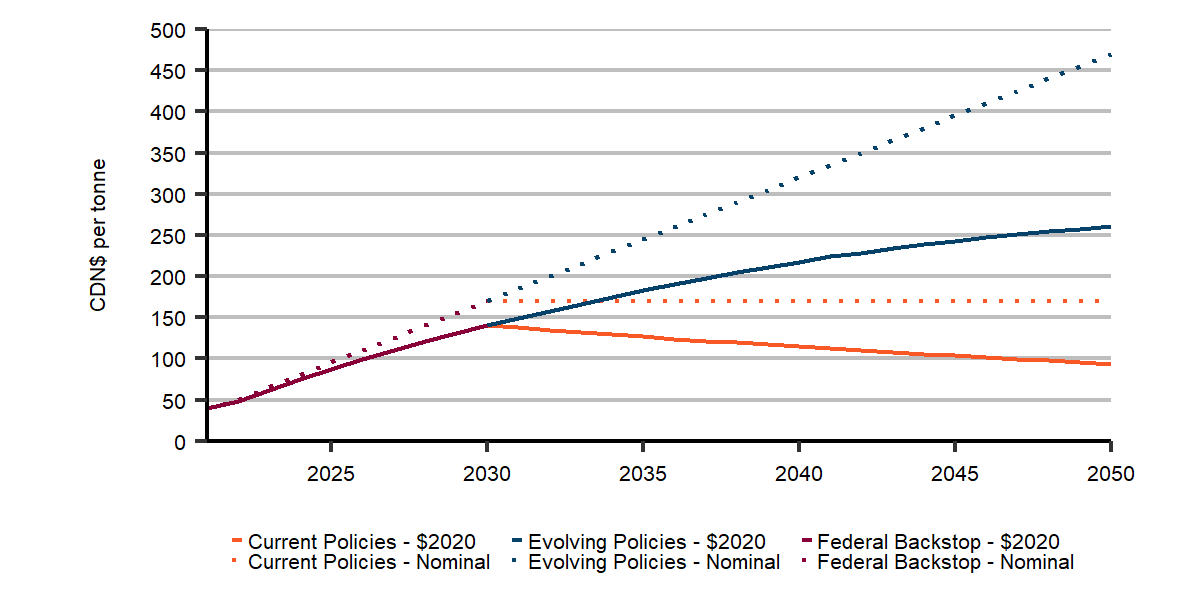
Table A.2 describes specific policy initiatives. Figure A.2 compares the federal backstop carbon price to the increasing cost of carbon pollution in the Evolving Policies Scenario.
Table A.2: Overview of Domestic Policy Assumptions
Key Differences Between Scenarios |
|
|---|---|
| Key Existing Policy Assumptions: the base for policy assumptions in the Evolving Policies Scenario, while the Current Policies Scenario only includes these existing policies. | |
| Policy | Description |
| Carbon Pricing | Current provincial and territorial systems, as well as the Federal Carbon Pricing Backstop. |
| Coal Phase Out | Traditional coal-fired generation is phased out of electricity generation by 2030. |
| Clean Fuel Regulation | Liquid fuels only, where standard strengthens to 2030. |
| Energy Efficiency | Currently in place regulations including appliance standards, building codes, and vehicle standards. |
| Electric Vehicles | Provincial policies and initiatives including those in British Columbia (B.C.) and Quebec, as well as Federal rebates and infrastructure program.Footnote 5 |
| Renewable Energy | Current requirements for renewable electricity, and blending of ethanol, biodiesel, and renewable natural gas. |
| Key Future Policy Assumptions: hypothetical increases in policy stringency only included in the Evolving Policies Scenario | |
| Hypothetical Policy Change | Description |
| Carbon pricing | Carbon prices continue to rise beyond existing announcements. For the federal pricing system, prices continue to increase after 2030 at $15 per tonne of carbon dioxide equivalent (CO2e) per year, in nominal terms, as shown in Figure A.2. In systems for large emitters, such as the federal output-based pricing system, benchmarks are tightened by 2% annually from 2022 to 2050. |
| Low Carbon/Clean Fuel Regulations | The Federal Clean Fuel Regulation emission intensity improvement trend (2022-2030) for liquid fuels is extrapolated through the remainder of the projection period. A federal renewable natural gas blending requirement is introduced in 2030, rising to 10% by 2040. |
| Zero-Emission Vehicles | A federal zero-emission vehicle (ZEV) mandate is introduced in 2025, rising to 100% of new passenger vehicle sales by 2035 in the provinces. Remote communities and the territories are assumed to be exempt. |
| Energy Efficiency | Gradually stronger energy efficiency regulations across the economy, including net-zero-ready building codes, improving appliance standards, and increasing light-duty vehicle efficiency standards. |
| Support for clean energy technology and infrastructure | Policy continues to support new technology development as well as key infrastructure developments including electric transmission, carbon capture and storage (CCS), hydrogen production, and electric vehicle charging infrastructure. |
Figure A.2: Current Federal Backstop Carbon Pricing ScheduleFootnote 6 (2020 to 2030), and Evolving Policies Scenario Economy wide Carbon Pricing (2030 to 2050)
Description
Description: This figure compares the federal backstop carbon price to the increasing cost of carbon pollution in the Evolving Policies Scenario, in 2020 C$ per tonne. The Federal backstop price increases until 2030, where it is fixed at $170 nominal C$ per tonne, so when adjusted for inflation in this chart declines steadily to just below $100 2020 C$ per tonne in 2050. The cost of carbon pollution in the Evolving Policies Scenario, measured in 2020 C$ increases to just over $200 C$ per tonne by 2050.
Evolving Policies Scenario: Key Changes between EF2020 and EF2021
The Evolving Policies Scenario was introduced as the new primary scenario of the Canada’s Energy Future series in EF2020. In the time since EF2020 analysis was completed, there have been some significant changes in global and domestic trends that have led to revisions in Evolving Policies Scenario assumptions between EF2020 and EF2021. Key changes include:
- Significantly stronger domestic climate policy, including Canada’s Strengthened Climate Plan carbon price path. Several new domestic policy initiatives have been introduced, including a higher federal carbon pricing backstop to 2030, draft regulations for the federal clean fuel regulation, and several provincial and territorial policies and plans.
- Higher crude oil and natural gas prices in the near term, but lower prices in the longer term. Prices have trended higher than those in EF2020 in the near term, through the combined effect of pandemic recovery, vaccine rollout, and global crude oil production cuts. Over the longer term, EF2021 crude oil and natural gas prices are lower than EF2020, in light of several new international policy and GHG reduction target announcements.
- Increased momentum for emerging technologies. Since EF2020’s release, Canada has released hydrogen and small modular reactor (SMR)Definition * roadmaps. Automakers have announced more models of electric vehicles (EVs). Several major carbon-capture and storage (CCS) and hydrogen projects have also been announced. Footnote 7
Technology
Technological changes can have large impacts on energy systems. There is a strong link between policies and the pace of technological development. Policy frameworks are key drivers of technological innovation and greater use of GHG-reducing technologies. Over the past decade, technological advancements have provided access to unconventional fossil fuel resources and dramatically reduced the cost of technologies like wind, solar, and batteries. The Evolving Policies Scenario assumes substantial technological progress, including adoption of many promising technologies currently in the early stages of commercialization. The Current Policies Scenario assumes slower technological progress compared to the Evolving Policies Scenario, including incremental efficiency improvements and cost reductions for well-established technologies. Table A.3 provides an overview for key technology assumptions in the Evolving and Current Policies Scenarios.
Table A.3: Technology Assumptions, Evolving and Current Policies Scenarios
| Technology | Evolving Policies Scenario | Current Policies Scenario |
|---|---|---|
| Wind and Solar Electricity | Costs fall and performance improves. See Table A.4 for details. | Costs continue to fall, but at a slower rate than the Evolving Policies Scenario. See Table A.4 for details. |
| Electric Vehicles | Battery costs fall from 2020US$ 170/kilowatt (kW) in 2021 to $ 45/kW in 2050 (reduction of 74%). | Battery costs fall to 2020US$ 100/kW by 2050 (reduction of 40%). |
| Hydrogen | Cost of low-carbon hydrogen falls throughout the projection period. Electrolysis hydrogen falls from $2020 US$ 6-10 currently to $1.5-6 by 2050. Natural gas with CCS derived hydrogen falls from $2020 US$ 1.6-2 currently to $1.5-1.7 by 2050. | Currently announced projects included. |
| Renewable Natural Gas | Costs an average 2020US$ 15/GJ throughout the projection, with a maximum demand of 500 petajoules (PJ). | Only current projects and in-place blending policies (B.C. and Quebec) are included. |
| Solvent-Assisted Oil Sands Extraction | All new oil sands facilities added post 2025 include solvent-assisted extraction. Adoption in existing facilities begins in the latter half of the projection period. | Limited adoption of solvent-assisted technology. |
| Small Modular Nuclear Reactors (SMRs) | Cost falls from 2020US$ 7000/kW in 2030 to 6000/kW in 2040, 5000/kW in 2050. | Not included. |
Critical Minerals and the Energy Transition
A continued global transition toward low-emission energy systems will involve the deployment of many existing and emerging technologies, such as wind turbines, solar panels, and batteries. These technologies require input materials, and global scenario analysis (such as International Energy Agency’s (IEA’s) Net Zero by 2050 and The Role of Critical Minerals in Clean Energy Transitions, and MIT Energy Initiative’s Insights into Future Mobility) are increasingly focused on the inputs necessary to produce these technologies. The cost and availability of minerals that are needed to manufacture low-carbon technologies are key uncertainties for energy systems.
Increasing demand for these critical minerals (such as lithium, cobalt, nickel, and copper) could put upward pressure on their prices. In turn, increasing raw material prices could limit cost reductions for wind, solar, and batteries. If costs of these technologies are higher than assumed in the EF2021 scenarios (see Table A.4), there could be lower adoption than projected, and/or higher energy system costs.
Conversely, sustained demand for critical minerals can encourage investment in new sources of supply or increased recycling, potentially keeping price increases at bay or even driving down prices over time.Footnote 8 Technology development could offset potential increases in input material costs through changes in design (such as changing lithium-ion battery chemistry to use less cobalt, and/or use of different technologies, such as moving towards a solid-state battery and away from the nickel-manganese-cobalt technology used today), or production improvement.Footnote 9
Although the outlook for the global critical minerals market is uncertain, it is clear that mining critical minerals for low-carbon technologies will have major economic impacts. The IEA’s Net Zero Energy scenario estimates that the global value of select critical minerals will grow substantially over the next two decades, reaching today’s level for coal market value (about $400 billion 2019USD) by 2040. In the Canadian context, the Canadian Institute for Climate Choices’ Canada’s Net Zero Future study finds that increased mining and manufacturing activity could be an important contributor to Canada’s economic growth as Canada and the world decarbonize.
Crude Oil and Natural Gas Markets
International crude oil and natural gas prices are a key driver of the Canadian energy system and are determined by supply and demand factors beyond Canada’s borders. Canadian crude oil and natural gas benchmark prices (such as Western Canada Select (WCS)Definition * for heavy crude oil and Nova Inventory Transfer (NIT)Definition * for natural gas) are driven by international trends, but are also driven by local factors, such as local crude quality and adequacy of pipeline capacity. In recent years, the availability of pipeline capacity within and leaving western Canada has been a key issue that has affected both Canadian markets and production levels.
Figure A.3 shows the EF2021 crude oil assumptions for BrentDefinition *, the primary global benchmark price for crude oil, for the Evolving and Current Policies scenarios. Global crude oil prices fell in 2020 due to the COVID-19 pandemic. In the second half of 2021, prices have increased to 2019 levels and above. In the longer term, prices in the Evolving and Current Policies scenarios diverge based on their different premises. In the Evolving Policies Scenario increased global action on climate change, which implies reduced demand for crude oil relative to the Current Policies Scenario, puts downward pressure on prices and the Brent price declines to 2020US$40/barrel (bbl)Footnote 10 by the end of the projection period, from 2020US$68/bbl in 2021. In the Current Policies Scenario, crude oil prices stay at 2020US$70/bbl over the projection period. In both scenarios, West Texas Intermediate (WTI)Definition *, a key North American crude benchmark, is 2020US$4.00 lower than Brent in the long term.
Both EF2021 scenarios assume that the Canadian heavy benchmark price is discounted to WTI consistent with the historical average. The WTI-WCS differentialDefinition * is 2020US$12.50/bbl for most of the projection. However, in reality, if future supply available for export approaches and/or exceeds the level of total capacity provided by pipelines and structural rail, this differential could increase significantly. We do not adjust the assumed differential for such dynamics. Figure R.14 in the “Results” section provides an illustration of how tight or constrained pipeline capacity could become in our two scenarios, based on existing pipeline capacity, planned pipeline expansions, and structural rail.
Figure A.3: Brent Crude Oil Price Assumptions to 2050, Evolving and Current Policies Scenarios

Description
Description: This figure shows Brent crude oil price assumptions in 2020 US$ per barrel from 2015 to 2050 for both scenarios. The Current Policies Scenario remains at $75 for most of the projection. The Evolving Policies Scenario Brent crude oil price decreases to $55 by 2026, then to $40 by 2050.
Figure A.4 shows the EF2021 natural gas price assumptions for the Evolving and Current Policies Scenarios. Over the projection period, Henry HubDefinition *, a key North American benchmark price, increases gradually reaching 2020 US$3.60/MMBtu by 2050 in the Evolving Policies Scenario, from $3.00/MMBtu in 2021. In the Current Policies Scenario, natural gas prices rise faster, reaching 2020 US$4.40/MMBtu by 2050. This is consistent with greater North American demand growth and LNG export volumes compared to the Evolving Policies Scenario. EF2021 assumes Henry Hub is 2020US$0.90/MMBtu higher than NIT for the majority of the projection. However, the NIT price discount could materially rise if there are periods where pipeline capacity becomes constrained for moving western Canadian natural gas to markets.
Figure A.4: Henry Hub Natural Gas Price Assumptions to 2050, Evolving and Current Policies Scenarios

Description
Description: This figure shows Henry Hub natural gas price assumptions in 2020 US$ per one million British Thermal Units (MMBtu) from 2015 to 2050 for both scenarios. Both scenarios gradually increase for much of the projection period. The Evolving Policies Scenario reaches $3.64/MMBtu by 2050, while the Current Policies Scenario increases to $4.40/MMBtu.
EF2021 assumes LNG export volumes from Canada as shown in Figure A.5. We assume all volumes originate from Canada’s west coast. These volumes include Phase 1 of the LNG Canada project, which has a positive final investment decision and is currently under construction. We also include an assumption of additional volumes that are not specific to a particular project. The Current Policies Scenario assumes greater LNG exports than in the Evolving Policies Scenario, beginning in 2039. Future LNG development is uncertain and could be significantly different than implied by these assumptions. For both scenarios, we assume that 75% of the natural gas that will be liquefied will come from natural gas production dedicated to supplying LNG facilities. This means that this 75% comes from production that only exists because LNG export capacity exists and is above and beyond what would be produced based solely on our North American natural gas price assumptions.
Figure A.5: Canadian LNG Export Volume Assumptions to 2050, Evolving and Current Policies Scenarios

Description
Description: This figure shows LNG export volume assumptions for both scenarios, 2020 to 2050, measured in billion cubic feet per day (Bcf/d). Assumed exports in both scenarios reach 3.7 Bcf/d in the mid-2030s. In the latter half of the projection, Evolving Policies Scenario exports increase to 4.9 Bcf/d, while Current Policies Scenario exports increase to 7.1 Bcf/d.
Full benchmark price assumption data and LNG export assumption levels are available in the accompanying data files and appendices, described in the “Access and Explore Energy Futures Data” section.
Electricity
The analysis in EF2021 reflects current utility and system operator expectations of future electricity developments in their respective regions, especially for major planned projects. We also make assumptions on the cost to add new electricity generating capacity in the future. Table A.4 shows assumptions for natural gas, solar, and wind costs, including their capacity factors. Current schedules and plans from utilities, companies, and system operators are the primary basis for the timing and magnitude of other forms of generation added over the projection period (such as hydroelectric and nuclear refurbishments).
As discussed earlier in this section, costs for wind, solar, and other emerging technologies are lower in the Evolving Policies Scenario than the Current Policies Scenario. This assumes a stronger global shift towards these low-carbon technologies, and advancements and efficiencies that continue to lower their costs and improve their performance.
Table A.4: Electricity Cost Assumptions for Natural Gas, Onshore Wind, and Utility Scale Solar to 2050, Evolving and Current Policies Scenarios
| Capital Cost (2020CN$/kilowatt(kW)) |
Fixed Operating and Maintenance Costs (2020CN$/kW) |
Variable Operating and Maintenance Costs (2020CN$/megawatt hour(MWh)) |
Capacity Factor (%)Footnote 11 | |
|---|---|---|---|---|
| Gas Combined Cycle (2020-2050, both scenarios) | 1 300-1 800 | 21 | 5 | 70 |
| Gas Peaking (2020-2050, both scenarios) | 950-1 400 | 18 | 5 | 20 |
| Wind (2020) | 1 389 | 25-60 | 0 | 30-45 |
| Solar (2020) | 1 516 | 20-27 | 0 | 10-20 |
| Evolving Policies Scenario | ||||
| Wind (2030) | 1 115 | 25-60 | 0 | 35-55 |
| Wind (2040) | 868 | 25-60 | 0 | 35-55 |
| Wind (2050) | 676 | 25-60 | 0 | 35-55 |
| Solar (2030) | 972 | 20-27 | 0 | 15-25 |
| Solar (2040) | 605 | 20-27 | 0 | 15-25 |
| Solar (2050) | 376 | 20-27 | 0 | 15-25 |
| Current Policies Scenario | ||||
| Wind (2030) | 1 226 | 25-60 | 0 | 30-45 |
| Wind (2040) | 1 184 | 25-60 | 0 | 30-45 |
| Wind (2050) | 1 117 | 25-60 | 0 | 30-45 |
| Solar (2030) | 1 066 | 20-27 | 0 | 10-20 |
| Solar (2040) | 772 | 20-27 | 0 | 10-20 |
| Solar (2050) | 561 | 20-27 | 0 | 10-20 |
Figure A.6: Wind and Solar Capital Costs and Levelized CostFootnote 12 Assumptions to 2050, Evolving Policies Scenario

Description
Description: This graph shows the ranges of wind and solar capital and levelized costs from 2020 to 2050 in the Evolving Policies Scenario. In 2020, the average wind and solar capital costs were 1 389 and 1 516 $2020 US$ per kilowatt (KW), respectively. By 2050, the average capital costs fall to 676 and 376 $2020 US$/KW, respectively.
In 2020, the average wind and solar levelized costs of electricity were 38 and 70 $2020 US$ per megawatt-hour (MWh), respectively. By 2050 the average levelized costs fall to 26 and 24 $2020 US$/MWh, respectively.
Hydrogen
Hydrogen can be produced from organic compounds such as biomass, natural gas, or coal through various processes. It can also be produced from water via electrolysis. The two main forms of production in EF2021 are electrolysis and natural gas with CCS.
- Natural gas with CCS: Currently, the most common method for hydrogen production is steam methane reforming of natural gas. In this method, high-temperature steam reacts with methane to produce hydrogen and carbon dioxide (CO2). Coupling this method with a carbon capture and storage technology (CCS) can produce hydrogen with relatively low CO2 emissions. Going forward, autothermal reforming (ATR) could have a cost advantage compared to steam methane reforming and could allow for a higher rate of CO2 capture. The recently announced Air Products project in Alberta is proposing to use an ATR technology for its facility. In our analysis we assume all natural gas with CCS hydrogen production has a capture rate greater than 90%. We also assume that because of proximity to sequestration capacity, hydrogen production from natural gas with CCS is only an option in B.C., Alberta, and Saskatchewan.
- Electrolysis: Electrolysis is a process whereby electricity is passed through water and splits water into its components: hydrogen and oxygen. Depending on the source of electricity, hydrogen produced through this process can have low-to zero-carbon emissions. EF2021 distinguishes between two categories of electrolysis based on how the electricity is supplied: a) grid electrolysis, which uses electricity from the provincial grid at a similar price to industrial users, and b) renewable electrolysis, which utilizes dedicated wind and solar resources.Footnote 13 Electrolysis is available in all provinces, and its adoption is based on relative costs.
Hydrogen production cost varies by region and resource availability. The cost of hydrogen production will depend on technology improvements and future electricity and natural gas prices. We assume costs significantly decline in the Evolving Policies Scenario (Table A.5), and remain near current levels in the Current Policies Scenario.
Table A.5: Hydrogen Technology Costs, Evolving Policies Scenario
| Cost by Technology type (2020US$/kg) | 2020 | 2030 | 2040 | 2050 |
|---|---|---|---|---|
| Electrolysis – Grid | $6.00-8.00 | $4.00-7.00 | $4.00-$6.00 | $4.00-6.00 |
| Electrolysis – Dedicated renewables | $8.00-10.00 | $4.00-6.00 | $2.00-$3.00 | $1.50-2.00 |
| Natural Gas with CCS | $1.60-2.00 | $1.50-$1.80 | $1.50-$1.80 | $1.50-$1.70 |
Given falling costs, as well as other policies such as increasing carbon prices, hydrogen has the potential for adoption across Canada’s energy system. The relative economics of hydrogen are a key driver of adoption in the various demand sectors. At the same time, each sector has some other important considerations and uncertainties.
- Residential and Commercial: There are physical limits on how much hydrogen can be blended into existing natural gas pipelines and used in conventional end-use devices.Footnote 14 To account for this uncertainty we assume maximum blending of hydrogen in the natural gas stream gradually increases throughout the projection period, as infrastructure and technology improves. Maximum blending increases to 3% by volume (1% by energy content) by 2030, 15% by volume (5% by energy content) by 2040, and 20% by volume (7% by energy content) by 2050.
- Industrial: Hydrogen demand is modeled on a sector-by-sector level, as industrial sectors have unique characteristics that could influence hydrogen adoption. Certain industries, such as iron and steel, have emerging technologies that are able to incorporate high concentrations of hydrogen as the main fuel. In some industries, such as cement production, it remains more uncertain if significant amounts of hydrogen will be consumable as a low carbon alternative fuel without significantly alerting the final industrial product.
- Transportation: As hydrogen costs fall, and carbon prices increase, hydrogen could offer substantial fuel cost savings compared to diesel in freight trucking. Adoption will be determined by other factors as well, such as the cost of hydrogen fuel cell trucks relative to conventional diesel trucks, as well as the development of hydrogen distribution and refuelling infrastructure. We assume fuel cell trucks become cost comparable to diesel trucks around 2035 to 2040, and infrastructure sees widespread deployment from 2035 to 2050 as hydrogen fuel cell trucks gain market share.
We assume that hydrogen is produced within each province to meet local demands, and there is no inter-provincial and international trade. This is an important assumption which affects the results, in that regions with lower cost options for producing low-carbon hydrogen – such as Alberta, with CCS access and announced projects, and Quebec, with relatively low grid electricity prices – are early adopters of the technology. This assumption follows recent hydrogen projects, which are intended for use at the facility where the hydrogen is produced, or in the nearby region. However, large-scale hydrogen trade has been proposedFootnote 15 and is still being analyzed. If significant trade between regions occurs, it could alter the production and consumption trends shown in our hydrogen results.
- Date modified: