The CER has issued an errata to correct several errors in the report
Results

This section presents results of the EF2021 projections. The primary focus is the Evolving Policies Scenario. These projections are not a prediction, but instead present possible future outcomes based on the assumptions described in the previous section. There are many factors and uncertainties that will influence future trends. Key uncertainties are discussed in each section.
For a description of the various ways to access the data supporting this discussion, including full data tables for both the Evolving and Current Policies scenarios, see the “Access and Explore Energy Futures Data” section.
Macroeconomics
The economy is a key driver of the energy system. Economic growth, industrial output, inflation, exchange rates, and population growth all influence energy supply and demand trends.
In the near term, the economy continues its gradual recovery from the COVID-19 pandemic. As shown in Figure R.1, total real gross domestic product (GDP)Definition * declined 5.3% in 2020, and grows by 5.7% in 2021.
Figure R.1: GDP Growth Rebounds Following a Steep Decline in 2020

Description
Description: This chart illustrates the short-term macroeconomic impact of COVID-19 through real GDP and GDP growth trends from 2018 to 2025. GDP declines from $2.10 trillion in 2019, to $1.99 trillion in 2020, a decline of 5.4%. By 2021 and 2022, GDP increases to $2.07 and $2.14 trillion, respectively. This corresponds to GDP growth of 4.3% in 2021, and 3.2% in 2022.
The long-term projections for key economic variables are in Figure R.2. Economic growth (adjusted for inflation) averages 1.6% per year over the projection period in both the Evolving Policies Scenario, and the Current Policies Scenario, with the Current Policies Scenario slightly higher. Economic growth over the projection is generally slower than the 1990 to 2018 historical period for a variety of reasons, including an aging population and slower global economic growth.
Figure R.2: Economic Indicators, Evolving and Current Policies Scenarios (2019-2050)

Description
Description: This chart shows average annual growth rates from 2019 to 2050 of several economic indicators for both the Evolving Policies and Current Policies scenarios. Real GDP grows by 1.57% in the Evolving Policies scenario, and 1.63% in the Current Policies scenario. Population grows by 0.78% in the Evolving Policies scenario, and 0.78% in the Current Policies scenario. Residential floorspace grows by 1.45% in the Evolving Policies scenario, and 1.46% in the Current Policies scenario. Commercial floorspace grows by 1.70% in the Evolving Policies scenario, and 1.74% in the Current Policies scenario. The consumer price index grows by 2.24% in the Evolving Policies scenario, and 2.11% in the Current Policies scenario.
Key Uncertainties: Macroeconomics
- COVID-19 pandemic recovery: Recovery from COVID-19 is a key uncertainty for global, North American, and Canadian macroeconomic growth.
- Global economic growth: Global economic growth affects many factors that are important for Canada’s economy, including commodity prices, and demand for Canadian energy and non-energy exports.
Energy Demand
This section first discusses secondaryDefinition * (or “end-use”) energy demand projections by reviewing energy use by sector of the economy, before turning to our economy wide primary energy demandDefinition * projections. End-use demand includes electricity and hydrogen, while the fuel used to produce electricity and hydrogen is accounted for in primary energy demand. Historical data is sourced primarily from Statistics Canada’s Report on Energy Supply and Demand in Canada. This data is supplemented with additional details from Environment and Climate Change Canada (ECCC), Natural Resources Canada, and various provincial data sources.
Key Trends: Energy Demand
- Total energy use declines in the Evolving Policies Scenario and grows slowly in the Current Policies Scenario.
- Growth rates for end-use demand by sector are lower than in the past for both scenarios.
- The mix of energy sources that Canadians use continues to change in the Evolving Policies Scenario, shifting towards a majority of low- or non-emitting energy sources in the longer term.
- In the Evolving Policies Scenario, energy use declines while population and GDP continue to grow, resulting in a significant decline in energy use per person and per dollar of economic activity.

View our data on energy demand by region, sector, fuel source, and scenario in our interactive visualization tool, Exploring Canada’s Energy Future.
Explore a summary of energy demand in our EF2021 Fact Sheets: Energy Demand.
In the near term, energy use follows macroeconomic trends. We estimate that demand declined 8% in 2020, and project it to increase in 2021 and 2022. In the long term, the Evolving Policies Scenario projects Canadian energy use to decline to 2050. Figures R.3 and R.4 break energy use down by sector, showing declines in all sectors. The largest declines are in the industrial (including upstream oil and gas) and transportation sectors. These declines are due to factors such as improved energy efficiency, increasing electrification of the transportation sector,Footnote 16 and various policies, like carbon pricing. Partially offsetting these factors, economic growth and a near-term increase in crude oil production provide some upward pressure on energy use. However, economic growth is slower than historical trends, and crude oil and natural gas production eventually declines. The Current Policies Scenario sees moderate demand growth over the projection period (though at levels lower than recent history) due to the lack of additional climate policy action beyond current policies, higher crude oil and natural gas production, and less electrification.
Figure R.3: End-use Demand Declines in All Sectors in the Evolving Policies Scenario

Click to enlarge
Figure R.4: End-use Energy Consumption Peaks in 2019 and Declines over the Long Term in the Evolving Policies Scenario

Click to enlarge
Figure R.3 Description
Description: This chart breaks down total end-use demand by sector from 2019 to 2050 for the Evolving Policies and Current Policies scenarios. From 2019 to 2050, residential demand decreases by 0.8% in the Evolving Policies Scenario, and is the same in the Current Policies Scenario. Commercial demand decreases by 0.8% in the Evolving Policies Scenario, and increases by 0.4% in the Current Policies Scenario. Industrial demand decreases by 1.0% in the Evolving Policies Scenario, and increases by 0.2% in the Current Policies Scenario. Transportation demand decreases by 1.2% in the Evolving Policies Scenario, and decreases by 0.6% in the Current Policies Scenario. Total end-use demand decreases by 0.7% in the Evolving Policies Scenario, and increases by 0.1% in the Current Policies Scenario.
Figure R.4 Description
Description: This chart shows total end-use energy demand by sector from 2005 to 2050 for the Evolving Policies Scenario. Residential demand decreases from 1 600 Petajoules (PJ) in 2019 to 1 233 PJ in 2050. Industrial demand decreases from 6 338 PJ in 2019 to 4 881 PJ in 2050. Commercial demand decreases from 1 473 PJ in 2019 to 921 PJ in 2050. Transportation demand decreases from 2 880 PJ in 2019 to 1 821 PJ in 2050.
Energy use trends vary by sector and by energy type in the Evolving Policies Scenario (See Figure R.5). These trends result from many different drivers, including macroeconomics, energy production trends, energy efficiency improvements, policies, technology advancements, and market developments. Highlights include:
- In the residential and commercial sectors, improving efficiency of devices and building envelopes reduces overall energy consumption. Rising carbon prices and improving technology drive penetration of heat pump technology in buildings, reducing natural gas use. Blending of renewable natural gas and hydrogen into natural gas streams also reduces natural gas use. This is driven by a combination of policy assumptions (see the “Scenarios and Assumptions” section), and economics in the longer term as carbon prices increase and technology costs fall.
- In the industrial sector, trends vary by industry. The oil and gas sector becomes more efficient, and production growth slows and eventually peaks for crude oil production, while natural gas production stays relatively steady and then declines. Solvent-assisted production in in situDefinition * oil sands helps improve energy intensity significantly in the latter half of the projection period. In the longer term, hydrogen reduces natural gas use, especially in key sectors such as iron and steel, cement, refining, as well as the oil and gas sectors. At the same time, increasing use of CCS puts upward pressure on energy demand as the CCS process requires energy.
- The transportation sector undergoes a notable low-carbon transition. Refined petroleum products (RPPs)Definition * like gasoline, diesel, and jet fuel have historically dominated the transportation sector, and this begins to change in the Evolving Policies Scenario. The Evolving Policies Scenario assumes that the recently announced Federal goal for all new vehicle sales to be Zero-Emission Vehicles (ZEVs)Definition * by 2035 is achieved, and that adequate supplies of battery and plug-in hybrid electric vehicles will exist and meet demand.Footnote 17 This substantially reduces gasoline demands in the projection. Electric freight, particularly light-to-mid-duty, hydrogen-powered freight (mid-to-heavy duty), and increasingly electrified public transportation (electric bussing) grow steadily in the 2030s and 2040s. Biofuels blending into gasoline and diesel increases from current levels in both scenarios, driven by policies like the Federal Clean Fuel Regulation.
Figure R.5: End-Use Energy Demand Trends Vary by Sector and By Fuel in the Evolving Policies Scenario

Description
Description: These four charts break down fuel demand for each sector throughout the projection period in the Evolving Policies Scenario.
Residential: Electricity demand increases from 617 Petajoules (PJ) in 2019 to 785 PJ in 2050. Natural gas demand decreases from 742 PJ in 2019 to 303 PJ in 2050. Refined petroleum product (RPP) demand decreases from 71 PJ in 2019 to 10 PJ in 2050. Biofuel demands decrease from 169 PJ in 2019 to 103 in 2050. Hydrogen demand increases from 0 PJ in 2019 to 31 PJ in 2050. Other fuel demands stay at 0 PJ throughout the projection period.
Commercial: Electricity demand increases from 542 PJ in 2019 to 485 in 2050. Natural gas demand decreases from 736 PJ in 2019 to 270 PJ in 2050. RPP demand decreases from 196 PJ in 2019 to 88 PJ in 2050. Biofuel demands increase from 0 PJ in 2019 to 50 PJ in 2050. Hydrogen demand increases from 0 PJ in 2019 to 28 PJ in 2050. Other fuel demands stay at 0 PJ throughout the projection period.
Industrial: Electricity demand increases from 862 PJ in 2019 to 1 014 PJ in 2050. Natural gas demand decreases from 2 933 PJ in 2019 to 1 254 PJ in 2050. RPP demand decreases from 1 907 PJ in 2019 to 1 418 PJ in 2050. Biofuel demands increase from 486 PJ in 2019 to 768 in 2050. Hydrogen demand increases from 0 PJ in 2019 to 371 PJ in 2050. Other fuel demands decline from 150 PJ in 2019, to 51 PJ in 2050.
Transportation: Gasoline demand decreases from 1 535 PJ in 2019 to 386 PJ in 2050. Diesel demand decreases from 831 PJ in 2019 to 218 PJ in 2050. Jet fuel demands increase from 353 PJ in 2019 to 374 PJ in 2050. Biofuel demands increase from 92 PJ in 2019 to 303 in 2050. Hydrogen demand increases from 0 PJ in 2019, to 22 PJ in 2050. Electricity demand increases from 4 PJ in 2019 to 337 PJ in 2050. Heavy fuel oil demand decreases from 45 PJ in 2019 to 22 PJ in 2050. LPG demand decreases from 12 PJ in 2019 to 2 PJ in 2050. Lubricant demand decreases from 3 PJ in 2019 to 4 PJ in 2050. Natural gas demand increases from 5 PJ to 175 PJ in 2050.
In this analysis, primary demand is the total amount of energy used in Canada. Primary demand is calculated by adding the energy used to generate electricity and hydrogen to total end-use demand, and then subtracting the end-use demand for electricity and hydrogen. Primary demand is higher than end-use demand due to factors such as heat loss in thermal electric generation, and the energy required for the hydrogen production process. This implies that it takes more than one unit of natural gas or coal to produce the same energy unit of electricity, and similarly more than one unit of natural gas or renewables to produce one energy unit of hydrogen.
Figure R.6 shows primary demand by fuel for the Evolving Policies Scenario, compared with total primary demand in the Current Policies Scenario. In the Evolving Policies Scenario, total demand gradually falls, driven by declining fossil fuel use. Coal demand declines considerably due to the phase out of coal-fired power generation. RPP demand falls along with improving energy efficiency and electrification of the transportation sector. Demand for non-energy oil products, such as asphalt, lubricants, and feedstocks are relatively stable. Natural gas demand grows slowly to about 2025, driven by increasing crude oil production as well as its increasing role in power generation. From 2025 to 2050 total natural gas demand steadily declines, as less is used for crude oil and natural gas production (due to both increased efficiency and, eventually, less production), energy efficiency improves, renewables replace some natural gas in power generation, and renewable natural gas and hydrogen are blended into the natural gas stream. Increasing natural gas use to produce hydrogen, as well as adding CCS to natural gas use in industrial electricity generation and power, partially offsets this decline.
Driven by increased electrification at the end-use level, overall electricity demand rises steadily in the Evolving Policies Scenario. This demand leads to stable production of nuclear power and growth in renewable power as major hydro projects are completed, and wind and solar costs continue to fall. Renewables become an increasingly important part of the energy mix. Increased blending of renewable fuels in liquid fuels and natural gas also support increasing renewable demand.
Figure R.6: Primary Demand Gradually Declines and Renewables Account for a Larger Share in the Evolving Policies Scenario Energy Mix

Description
Description: This chart breaks down primary energy demands in the Evolving Policies Scenario, by fuel, throughout the projection period. It also shows total primary energy demand for the Current Policies Scenario. In the Evolving Scenario, coal, coke and coke oven gas demand decreases from 713 petajoules (PJ) in 2019 to 58 PJ in 2050. Refined petroleum product (RPP) demand decreases from 5 067 PJ in 2019 to 2601 PJ in 2050. Natural gas demand decreases from 5 045 PJ in 2019 to 1 512 PJ in 2050. Hydro demands increase from 1 353 PJ in 2019 to 1 607 PJ in 2050. Nuclear demands increase from 1 057 PJ in 2019, to 1 073 PJ in 2050. Other renewables and landfill gas demand increases from 984 PJ in 2019, to 2 148 PJ in 2050. Total primary demand in the Evolving Policies Scenario decreases from 14 219 PJ in 2019, to 10 668 PJ in 2050, compared to an increase to 14 567 PJ in the Current Policies Scenario.
Energy use falls while both the economy and Canada’s population grow, implying that energy intensity–measured in energy use per capita or per $ of real GDP–declines significantly. This is shown in Figure R.7. From 2019 to 2050, real GDP increases 60% and population increases over 27% in the Evolving Policies Scenario. Primary energy use declines 25%. These different trends imply that energy use per $ of real GDP declines over 50% from 2019 to 2050, while energy use per person declines over 40% in the Evolving Policies Scenario.
Figure R.7: The Economy Grows Faster than Energy Use, and Energy Intensity Declines in both the Evolving Policies Scenario and the Current Policies Scenario

Description
Description: This chart breaks down total percent change in macroeconomic variables from 2020 to 2050 for both scenarios. For the Evolving Policies Scenario, real GDP increases by 62%, population increases by 27%, primary energy use decreases by 25%, energy use per person decreases by 41%, and energy use per $ GDP decreases by 52%. For the Current Policies Scenario, real GDP increases by 65%, population increases by 27%, primary energy use increases by 1%, energy use per person decreases by 21%, and energy use per $ GDP decreases by 37%.
Key Uncertainties: Energy Demand
- Future policy changes: In December 2020, Canada announced a significant increase to its carbon pricing pathway, and revisions to the proposed Clean Fuel Standard (published in the Canada Gazette as the Clean Fuel Regulation). Canada has recently committed to a stronger 2030 target in its Nationally Determined Contribution submitted to the United Nations, and announced intentions for 100% of passenger vehicle sales to be ZEVs by 2035. These changes illustrate how dynamic climate policy has been in recent years. This may continue if urgency and ambition to reach climate targets increases. Future policy changes will have significant impacts on energy projections.
- Technological influences: The impacts of technology on the energy system are substantial and can be difficult to predict. The Evolving Policies Scenario continues the momentum for increased use of established technologies and allows for the adoption of emerging technologies currently near commercialization. The pace, types, and costs of new technological adoption are highly uncertain and likely to be different from those assumed and modelled in our scenarios.
- Alternative fuels and new end-uses: Both core scenarios show a shift towards electricity, supported by the increasing use of renewables. They also feature increasing adoption of low-carbon fuel alternatives, such as hydrogen, renewable natural gas, and liquid biofuels, to varying degrees. Faster electrification of the economy, or investment and growth in alternative fuels production could lead to different trends compared to those shown here.
Crude Oil
Crude oilDefinition * is produced in Canada for domestic refining as well as for export. In 2019, Canadian crude oil production averaged 4.9 million barrels per day (MMb/d) (784 thousand cubic metres per day (10³m³/d)). Production declined by 5% in 2020, largely due to the COVID-19 pandemic, but had returned to 2019 levels by the end of 2020. In recent years, most production growth has been concentrated in the oil sands. Regionally, most production is in Alberta, with additional volumes in Saskatchewan and offshore Newfoundland and Labrador.Footnote 18
Figure R.8 shows Canadian crude oil production by type in the Evolving Policies Scenario, compared to total Current Policies Scenario production. Canadian crude oil production in the Evolving Policies Scenario peaks at 5.8 MMb/d (930 10³m³/d) in 2032 and declines to 4.8 MMb/d (756 10³m³/d) in 2050, a decrease of 4% from 2021. For comparison, production peaks at 6.7 MMb/d (1 064 10³m³/d) in 2044 in the Current Policies Scenario, driven by higher crude oil price assumptions and other assumptions related to the lack of future domestic and global climate policy action.
Key Trends: Crude Oil Production in the Evolving Policies Scenario
- Production grows through the start of the projection period with most growth occurring before 2025. After this point, production is relatively flat and peaks in 2032 at just under 5.8 MMb/d, before declining to 4.8 MMb/d in 2050. This compares to production of 5.0 MMb/d in 2021. Price assumptions underpin this growth. Longer term, assumptions of lower crude oil prices and increasing carbon costs lead to declines in production.
- From 2019 to 2032, crude oil production increases 19%. Between 2032 and 2050 production decreases by 19%.
- In situ bitumen production grows to 2.2 MMb/d in 2032 before declining to 1.9 MMb/d by 2050, from 1.7 MMb/d in 2021.
- Mined bitumen production peaks in 2024 at 1.7 MMb/d, declining thereafter to 1.4 MMb/d by 2050, from 1.6 MMb/d in 2021.

View our data on crude oil production by region, type, and scenario in our interactive visualization tool, Exploring Canada’s Energy Future.
Explore a summary of oil production in our EF2021 Fact Sheets: Oil Sands Production and Conventional, Tight, and Shale Oil Production.
Figure R.8: Total Crude Oil Production Peaks in 2032 and then Declines through 2050 in the Evolving Policies Scenario

Description
Description: This graph shows crude oil production by type from 2005 to 2050 in the Evolving Policies Scenario, and total production for the Current Policies Scenario. Canadian crude oil production in the Evolving Scenario peaks at 5.8 million barrels per day (MMb/d (922 10³m³/d)) in 2032 and declines to 4.7 MMb/d (756 10³m³/d) in 2050, an increase of 2% from 2020. For comparison, production peaks at 6.7 MMb/d (1 064 10³m³/d) in 2044 in the Current Policies Scenario.
Production growth in the oil sands continues in the near term, peaking in 2032 and declining slightly through 2050 in the Evolving Policies Scenario. Figure R.9 shows Evolving Policies Scenario oil sands production by type, while Figure R.10 shows it by vintage. Growth is dominated by in situ projects. Most production growth in this scenario are expansions to existing projects, which are profitable given Evolving Policies Scenario price levels and technology improvements that increase productivity.
ConventionalDefinition *, tightDefinition *, and shaleDefinition * production is classified as lightDefinition * or heavyDefinition *, depending on the API gravityDefinition * of the oil. In 2020, 51% of western Canadian conventional production was heavy and 49% was light. Near-term growth in production in these categories is primarily due to increases in light oil production in Alberta, along with growing heavy oil production in Saskatchewan. Light oil, particularly tight oil, growth is based on producers’ preference to target wells which have higher initial production rates and a quicker return on investment. Growth in Saskatchewan’s heavy oil production is due to the low cost and low decline rates of heavy oil reservoirs in the province (Figure R.11).
The majority of condensateDefinition * production has and is projected to come from Alberta. Growth in condensate production in the projection period occurs in Alberta and B.C., as producers focus on liquids-rich natural gas plays like the Montney Formation and the Duvernay (Figure R.12). Condensate is used as a diluentDefinition * for bitumen and heavy oil.
Newfoundland offshore production in the Evolving and Current Policies scenarios steadily declines as shown in Figure R.13. We assume no new discoveries in the Evolving Policies Scenario. Additional discoveries and developments could change these trends. In the Current Policies Scenario, we assume new discoveries are made and start producing oil beginning in 2032.
Figure R.9: Oil Sands Production Peaks in 2032 and then Declines throughout the Projection Period in the Evolving Policies Scenario

Click to enlarge
Figure R.10: Oil Sands Production: Existing vs. Projected Additions in the Evolving Policies Scenario

Click to enlarge
Figure R.11: Conventional, Tight, and Shale Oil Production Decreases Steadily over the Projection in the Evolving Policies Scenario After a Brief Increase Over the Next Five Years

Click to enlarge
Figure R.12: Condensate Production Driven by Increasing Diluent Demand in the Evolving Policies Scenario

Click to enlarge
Figure R.13: Newfoundland Offshore Oil Production Steadily Declines to 2050 in the Evolving Policies Scenario

Figure R.9 Description
Description: This chart shows oil sands production by type from 2005 to 2050. Mined bitumen production grows from 0.6 MMb/d in 2005 to peak at 1.7 MMb/d in 2032 before decreasing to 1.4 MMb/d in 2050. In situ bitumen production grows from 0.4 MMb/d to peak at 2.2 MMb/d before decreasing to 1.9 MMb/d by 2050.
Figure R.10 Description
Description: This graph shows oil sands production from 2010 to 2050 for the following categories: new, expansion, and existing. Existing production is 3 million barrels (MMb/d) per day in 2020, 3.4 MMb/d by 2035, and 3 MMb/d day by 2050. Production from expansion increases from 3 thousand barrels per day (Mb/d) in 2022 to 417 Mb/d by 2035, and 344 Mb/d by 2050.
Figure R.11 Description
Description: This graph shows Canadian conventional oil production from 2005 to 2050 in the Evolving Policies Scenario. Total production in 2005 was 1.03 MMb/d and the majority of production was made up by Alberta light oil and Saskatchewan heavy oil. By 2050, total production decreases to 0.65 MMb/d, with the majority continuing to be Saskatchewan heavy oil and Alberta light oil.
Figure R.12 Description
Description: This graph shows condensate production in Alberta and British Columbia from 2010 to 2050 in the Evolving Policies Scenario. In 2010 condensate production was 39 Mb/d and this increases to about 445 Mb/d in 2050.
Figure R.13 Description
Description: This chart shows Newfoundland offshore oil production from 2005 to 2050. Production in the Evolving Policies Scenario grows from 0.3 million barrels per day (MMb/d) in 2005 to 270 MMb/d in 2022. Production then declines, reaching 8 MMb/d by 2050. Production in the Current Policies Scenario grows to 303 MMb/d in 2023. Production then declines reaching 33 MMb/d by 2050.
New Technology in Oil Sands Production
In the Evolving Policies Scenario, we assume that technological improvement in extraction and upgrading methods of existing oil sands projects continues at the same pace as recent history. Although uncertainties exist, the improvements have the potential to reduce the per-barrel costs to produce bitumen, offsetting the higher carbon costs and lower commodity prices. These improvements also lead to lower per-barrel emissions.
Much of the growth in oil sands production is in the form of expansions to existing facilities. By the end of the projection, facility expansions make up 7% of all oil sands production, or just over 0.23 MMb/d. Growth also comes from new facilities. No new oil sands mining or upgrading facilities will be created over the projection period. However, new in situ facilities make up 4% or 0.11 MMb/d of total oil sands production from 2019 to 2050.
We assume new or expanded facilities, which begin production after 2025, use the following technologies to lower their emissions intensity:
Steam and pure solvents: The injection of heated solvents (typically a mixture of natural gas liquids (NGLs)) into the reservoir to replace the steam generation units currently in use, lowering emissions. This process also leaves some of the less desirable components within bitumen (asphaltenes) in the reservoir. Pure solvents have the potential to reduce per barrel operating costs by up to $3.50 per barrel.
In-pit extraction: A technique currently being developed by Canadian Natural Resources Limited at its Horizon Oil Sands mine, which involves separating oil sands ore into its component parts within the extraction pit of the operation. This method requires comparatively less heavy equipment and electric power, resulting in less emissions per barrel, and a potential cost savings of $2.00 per barrel.
A key issue for Canada’s energy system over the last number of years was the availability of crude oil export pipeline and rail capacity. This has implications for Canadian oil pricing and production trends. When total export capacity is very full, it can lead to widening differentials, particularly when there are unexpected outages. Figure R.14 is an illustrative comparison of our crude oil supply projections and the level of total export capacity that would be provided by existing pipeline capacity, planned pipeline expansions, and structural rail.Footnote 19 Making this comparison allows us to get an understanding of whether pipeline constraints might impact crude oil production in our scenarios. However, we do not adjust our crude oil production projections based on potential constraints.
In the Evolving Policies Scenario, crude oil available for export from western Canada stays below the total hypothetical export capacity throughout the projection period. However, into the mid-2030s the difference between capacity and supply is small. EF2021 does not assess whether in this scenario, additional pipeline capacity would be required to avoid constraining Canadian crude oil production below what is projected throughout the projection period.
In the Current Policies Scenario, supply exceeds capacity through much of the projection period. This clearly suggests that without additional pipeline capacity, production would be constrained below what is projected.
EF2021 does not explore the complexities of how pipeline infrastructure interacts with energy supply and demand outcomes. For example, some spare pipeline capacity can benefit crude oil producers by providing flexibility to access higher value markets or avoid the impacts of maintenance or unforeseen outages. It’s also possible that excess capacity and long-term underutilization of pipelines could result in higher pipeline tolls for crude oil producers. Analysis of these considerations is beyond the scope of EF2021. We caution readers from drawing definitive conclusions from the illustrative comparison shown Figure R.14.
It is also important to note that the estimate of what total available pipeline capacity and the level of structural rail could be is uncertain and the result of many key assumptions. Table R.1 describes the infrastructure assumptions that underpin Figure R.14. Available capacity on existing pipeline systems could be higher or lower than reflected in Figure R.14, as pipeline systems evolve over time. The level of structural crude by rail could also be somewhat higher or lower than reflected in this figure.
Figure R.14: Illustrative Export Capacity from Pipelines and Structural Rail, Crude Oil Pipeline Capacity vs. Total Supply Available for Export in the Evolving and Current Policies Scenarios

Description
Description: This chart shows illustrative export capacity from pipelines and structural rail versus total crude oil supply available from the Western Canadian Sedimentary Basin, for the Evolving and Current Policies Scenarios. Pipeline and structural rail capacity grows from 2.9 million barrels per day (MMb/d) in 2010 to 5.3 MMb/d in 2050. In the Evolving Policies Scenario, crude oil available for export grows from 4 MMb/d in 2020 to a projected 4.9 MMb/d in 2035 before declining to 4.3 MMb/d by 2050. In the Current Policies Scenario, crude oil available for export grows from 4.0 MMb/d in 2020 to a projected 5.8 MMb/d in 2035 where it stays until 2050.
Table R.1: Pipeline Capacity Assumptions for Figure R.14
| Name | Takeaway Capacity (current or timing as noted) (Mb/d) | Notes |
|---|---|---|
| Enbridge Mainline | 3 207 | Stated capacity includes the fully completed Line 3 Replacement Project which adds 370 Mb/d of capacity to the Enbridge Mainline in late 2021. |
| Keystone | 586 | Capacity held fixed over the projection period. The cancelled Keystone XL project is not included in Figure R.14. |
| Trans Mountain | 300 | Capacity is held fixed over the projection period. This capacity approximates the crude oil portion of capacity, by removing 50 Mb/d from the full capacity of Trans Mountain (350 Mb/d) to accommodate transportation of 50 mb/d of RPPs on the pipeline. |
| Trans Mountain Expansion | 540 | The Trans Mountain Expansion Project adds capacity starting in December 2022, and increases to full capacity by the spring of 2023. As with the existing Trans Mountain system, full capacity of the Trans Mountain Expansion (590 Mb/d) is reduced to accommodate transportation of 50 Mb/d of RPPs. |
| Express | 310 | Capacity held fixed over the projection period. |
| Milk River | 97 | Capacity held fixed over the projection period. |
| Aurora/Rangeland | 44 | Capacity held fixed over the projection period. |
| Structural Rail | 120 | Capacity held fixed over the projection period. |
| Capacity Increases to Existing Pipelines | 58 | Includes announced optimizations to boost the capacity of existing pipelines. The capacity increases are reflected in 2021 to 2023. |
| Total | 5 262 |
Global fossil fuel market dynamics and implications for Canadian production trends
The Evolving and Current Policies scenarios explore the impact of changing policy trends, both domestic and global, on the Canadian energy system. The results show that the different assumptions in the scenarios have a large effect on Canadian crude oil and natural gas production projections. This establishes future climate action–particularly global action, which impacts global demand and prices–as a key uncertainty for Canadian production levels. At a high level, the EF2021 production projections have a similar conclusion to global scenario work from the IEA, and companies such as BP and Shell: increasing levels of climate action will decrease production.
Over the past several years, there has been an increasing body of scenario analysis on what net-zero by 2050 means for the global energy system. Figure R.15 shows global oil and natural gas demand trends in a variety of scenarios that vary in their level of decarbonization. The range presented here is large and includes both business as usual and net-zero scenarios. For global oil demand, these scenarios have a range of 37% more to 73% lower compared to current levels by 2050. For natural gas, global demand ranges from 68% more to 54% less relative to current levels by 2050.
Figure R.15: Growth of Global Natural Gas and Oil Demand, Various International Scenarios by Other Organizations

Description
Description: This graph compares several organization’s projections of oil and gas demand indexed to 2010 levels, where 2010 levels are equal to 1. By 2050, global gas demand is 1.0 in Shell Sky, 1.7 in BP Business-as-usual, 1.2 in BP Rapid, 0.8 in BP Net Zero, 1.6 in EIA 2021 Reference, 1.1 in IEA Announced NZ Pledges, 1.6 in IEA Stated Policies, 0.3 in IEA Net Zero by 2050, and 0.7 in IEA Sustainable Development. By 2050, global oil demand is 0.9 in Shell Sky, 1.0 in BP Business-as-usual, 0.6 in BP Rapid, 0.3 in BP Net Zero, 1.4 in EIA 2021 Reference, 0.9 in IEA Announced NZ Pledges, 1.2 in IEA Stated Policies, 0.3 in IEA Net Zero by 2050, and 0.5 in IEA Sustainable Development.
If the assumptions made in the global net-zero scenarios materialize, there will likely be significant impacts for global crude oil and natural gas markets. In the IEA’s Net Zero by 2050 scenario, the global crude and North American natural gas prices are significantly lower than the Evolving Policies Scenario assumptions. The Canadian Institute for Climate Choices Net Zero Report finds that only scenarios with high oil prices and high levels of carbon dioxide removals see Canadian oil production similar to current levels in the long term. These results suggest that in a net-zero world, there could be significant decreases in Canadian oil and natural gas production.
Canadian fossil fuel production in a net-zero world will depend on many factors, such as:
- market prices,
- the evolution of light and heavy oil refinery demand,
- the cost of reducing the upstream emissions of Canadian oil and natural gas production, and
- the extent to which low-carbon natural gas technologies (such as CCS-equipped hydrogen production, electricity generation and industrial use with CCS, and natural gas use for direct air capture) are implemented.
In addition, oil and natural gas production is itself a large user of energy in Canada. As a result, the uncertainty in future production trends is an uncertainty for Canadian energy demand and GHG emissions trends. In the Evolving Policies Scenario, the oil and gas sector makes up about 20% of the remaining unabated fossil fuel demand in Canada in 2050, down from approximately 30% today. The future of global oil and gas trends, and how they affect Canadian investment and production trends, will therefore likely be important for Canada’s own net-zero transition.
Key Uncertainties: Crude Oil Production in the Evolving Policies Scenario
- Future crude oil demand: As climate policy announcements and ambitions increase around the world, many global scenarios have shown a significant reduction in global crude oil demand. These reductions may be needed to meet Paris climate goals of keeping temperature increases to well below 2 degrees Celsius, and to preferably limit warming to 1.5. If these ambitions are realized, falling crude oil demand could have significant impacts on market prices and investment that would affect future Canadian hydrocarbon production (see box “Global fossil fuel market dynamics and implications for Canadian production trends”).
- Technological development in the oil sands: Reducing GHG emissions and costs are two significant factors in the future development of oil sands facilities. Technologies are currently being developed to address both aspects, although their future adoption is uncertain. As in previous editions of Canada’s Energy Future, EF2021 assumes that companies continue to work towards lowering both the cost and GHG emissions of their operations.
- Western Canadian takeaway capacity: EF2021 assumes that western Canadian crude oil prices will consistently track prices in international markets, consistent with historical averages. The balance between future export pipeline capacity and supply available for export could affect future price relationships and crude oil production levels (see box “Crude Oil Pipelines in Canada’s Energy Future” in the Executive Summary).
- ESG considerations: The investment community is shifting its attention towards firms that align with their environmental, social, and governance (ESG)Definition * performance criteria.Footnote 20 The extent and nature to which ESG considerations may alter upstream investment trends could affect future production trends.
Natural Gas
In Canada, natural gasDefinition * is produced for domestic use and exports. In 2020, Canadian marketable natural gas production averaged 15.5 Bcf/d or 438 million cubic metres per day (106>m³/d).
Natural gas production in Alberta has been relatively flat over the last few years, while B.C. production has been steadily increasing since 2010. This increase has been driven by a variety of factors including:
- Drilling to evaluate natural gas resources expected to supply LNGDefinition * exports off of Canada’s west coast.
- NGLsDefinition * in the Montney tight gas play driving drilling and production despite lower natural gas prices.
- Horizontal drilling and hydraulic fracturingDefinition * technological advancements.
In the Evolving Policies Scenario, natural gas production remains near 2020 levels of 15.5 Bcf/d through much of the next two decades. The additional investment in production to meet assumed LNG export volumes sustains production levels. Without these investments, production would otherwise decline, given the assumed North American natural gas prices and the costs associated with assumed domestic climate policies. After 2040, with LNG exports assumed to stay flat, total natural production begins to decline, falling to 13.1 Bcf/d by 2050. Much of the production growth related to LNG exports occurs in B.C., and production in B.C. surpasses that of Alberta by 2028.Footnote 21
In the Current Policies Scenario, natural gas production continues increasing in the longer term, reaching 22.2 Bcf/d (627.4 106>m³/d) by 2050. Current Policies Scenario projections are driven by assumptions of higher prices, a lack of future domestic and global climate action, and higher LNG exports.
Key Trends: Natural Gas Production
- Natural gas production is fairly level in the Evolving Policies Scenario to 2040, before declining through the remainder of the projection period.
- Production from the Montney Formation in the form of liquids-rich tight gas grows significantly and becomes the majority of Canadian production over the projection period.
View our data on natural gas production by region, type, and scenario in our interactive visualization tool, Exploring Canada’s Energy Future.
Explore a summary of gas production in our EF2021 Fact Sheets: Natural Gas Production and Natural Gas Liquids Supply and Disposition.
Figure R.16: Total Natural Gas Production Declines in the Evolving Policies Scenario and Increases in the Long Term in the Current Policies Scenario

Description
Description: This graph shows Canadian natural gas production by province from 2005 to 2050 in the Evolving Policies Scenario, and total production in the Current Policies Scenario. In the Current Policies Scenario production continually increases to 22.2 Bcf/d in 2050. In the Evolving Policies Scenario total production in 2005 was 16.7 Bcf/d, peaked at 16.2 Bcf/d in 2018, and then slowly declines to 13.1 Bcf/d in 2050. Nearly all of future production comes from Alberta and British Columbia, with British Columbia becoming the largest gas producer by 2028 in the Evolving Policies Scenario. In 2050, British Columbia natural gas production is 8.3 Bcf/d and Alberta production is 4.6 Bcf/d.
Figure R.17 shows production of natural gas by type in the Evolving Policies Scenario. Production is increasingly made up of tight natural gasDefinition * produced from the Montney Formation in Alberta and B.C., which has already grown significantly over the past five years. Alberta Deep Basin tight natural gas production declines. There are minimal amounts of shale gasDefinition * production from the Duvernay and Horn River shales, while solution gasDefinition * declines and coal bed methaneDefinition * production declines significantly over the projection period.
Figure R.17: Natural Gas Production is Increasingly Made Up of Montney Formation Tight Gas in the Evolving Policies Scenario

Description
Description: This graph shows natural gas production by type from 2005 to 2050 in the Evolving Policies Scenario. Total production in 2015 was 15.1 billion cubic feet per day (Bcf/d), with tight and shale gas production at 9.7 Bcf/d. In 2050 total gas production is 13.1 Bcf/d, with tight and shale gas making up the majority of production at 12.4 Bcf/d.
Figure R.18 illustrates total Evolving Policies Scenario production divided into production that would result from the market prices of the Evolving Policies Scenario, and additional production due to LNG exports. The additional LNG-related production is based on our assumption that 75% of LNG feedstock comes from incremental production that only exists because LNG export capacity exits. The other 25% of LNG feedstock is supplied by the market-driven production (i.e. production that occurs based on assumed North American gas prices). Figure R.18 shows that without additional production to feed LNG exports, production would continuously decline over the projection period to 9.5 Bcf/d (267.7 106>m³/d) in 2050.
Figure R.18: LNG Exports Support Natural Gas Production in the Evolving Policies Scenario

Description
Description: This graph shows natural gas production broken out into the categories of market production and additional production for LNG from 2000 to 2050. Market production rises from 14.2 Bcf/d in 2010 to 15.4 Bcf/d by 2020, then declines to 9.4 Bcf/d by 2050. Additional production for LNG is 0 Bcf/d until 2024 before increasing to 3.7 Bcf/d by 2050.
Natural gas exports to the western U.S. have increased over the last several years. Imports to Canada have been relatively steady over the last decade, ranging from 2-3 Bcf/d (57-85 106>m³/d). Imports could potentially rise as pipeline capacity increases from the northeastern U.S. to Dawn, Ontario.
Figure R.19 breaks total marketable production in the Evolving Policies Scenario into a) Canadian marketable demand, b) the assumed LNG export volumes, and c) the remaining implied net exports. The remaining implied net exports is mostly by pipeline and calculated as Canadian natural gas production minus Canadian demand and LNG exports.Footnote 22 Remaining implied net exports shrink throughout the projection period, resulting from the production, consumption, and LNG export trends discussed earlier in this section. Lower remaining implied net exports do not necessarily mean that non-LNG exports are falling, just that the difference between imports and non-LNG exports is smaller.
Figure R.19: Natural Gas Supply and Demand Balance sees the Increasing Importance of LNG Exports as Domestic Demand Declines in the Long Term in the Evolving Policies Scenario

Description
Description: This graph shows natural gas production, demand, assumed LNG exports, and net pipeline exports from 2015 to 2050 in the Evolving Policies Scenario. From 2015 to 2040, marketable production increases from 15.0 Bcf/d to 15.2 Bcf/d, and then slowly declines to 13.4 Bcf/d in 2050. Demand increases from 9.7 Bcf/d in 2015 to 12.1 Bcf/d in 2025, then declines to 7.37 Bcf/d in 2050. LNG exports increase from 0 to 4.9 Bcf/d. Net exports in 2015 are 5.5 Bcf/d, and trend down to 1.6 Bcf/d in 2030, and 0.9 Bcf/d in 2050.
Key Uncertainties: Natural Gas Production
- Future international natural gas prices: Benchmark U.S. prices (i.e. Henry Hub) could be higher or lower, which would lead to different production results under both EF2021 scenarios.
- Western Canadian natural gas price discounts: Differentials for western Canadian natural gas relative to Henry Hub could be affected by many factors, including pipeline bottlenecks and market dynamics. Differentials that vary from what we assume could lead to different production in the longer term.
- Future natural gas demand: As climate policy announcements and ambition increase around the world, many global scenarios have shown a significant reduction in global natural gas demand (see textbox “Global fossil fuel market dynamics and implications for Canadian production trends”). If these ambitions are realized, falling natural gas demand could have significant impacts on market prices and investment that would affect future Canadian hydrocarbon production. At the same time, the extent to which natural gas is used for low-carbon hydrogen production and/or direct air capture could impact natural gas demand trends in low-emission scenarios.
- LNG exports: It is possible that global market conditions and the costs of constructing new LNG export capacity may change in the future, influencing future volumes of LNG exports from Canada in both EF2021 scenarios.
- ESG considerations: The investment community is shifting its attention towards firms that align with their ESG performance criteria.Footnote 23 The extent and nature to which ESG considerations may alter upstream investment trends could affect future production trends.
Natural Gas Liquids
Natural gas liquids (NGLs) are produced along with natural gas, as well as from oil sands and refinery processes. Natural gas production is the main source of NGL production in Canada. Demand for certain NGLs adds value to natural gas production and has been a driver of natural gas drilling. Raw natural gas at a wellhead is comprised primarily of methane, but often contains NGLs such as ethaneDefinition *, propaneDefinition *, butaneDefinition *, condensate and other pentanesDefinition *.
Figure R.20 shows that total NGL production grows around 10% to 2050 in the Evolving Policies Scenario, from the 1 159 Mb/d (184 10³m³/d) produced in 2020. Growth is dominated by condensateDefinition *, which grows 28% by 2050. Condensate, along with butanes, are added to bitumen as a diluent to enable it to flow in pipelines and be loaded on to rail cars. Condensate demand has, and will continue to, influence natural gas drilling to focus on NGL-rich plays.
Propane and butane production declines slightly over the projection period in the Evolving Policies Scenario. Demand for these NGLs increases in the medium term as demand from petrochemical producers in Alberta increases, which may affect export levels of propane and butane.
The majority of ethane is extracted at large natural gas processing facilitiesDefinition * located on major natural gas pipelines in Alberta and B.C. In 2020, ethane made up 20% of NGL production. Ethane production is flat in the Evolving Policies Scenario, as its recovery from the natural gas stream is constrained by the capacity of the ethane extraction and petrochemical facilities in Alberta, which is assumed to remain constant. Ethane produced in excess of this capacity is reinjected back into the natural gas pipeline system to be consumed by end-users as natural gas, and these volumes do not count in our ethane production numbers.
In the Current Policies Scenario, total NGL production grows 70% to 1 967 Mb/d (313 10³m³/d). NGL production growth is due to natural gas production growth in this scenario. Condensate also has the most significant growth in this scenario–growing 121% over the projection, from 349 Mb/d (56 10³m³/d) in 2020 to 770 Mb/d (122 10³m³/d) in 2050.
Additional Detail on Crude Oil, Natural Gas, and NGL Projections
- For additional data on crude oil, natural gas and NGL production, see the EF2021 Data Appendices. These datasets include additional geographical and monthly details on production and drilling trends.
- Further information about these and other available EF2021 data sets can be found in the “Access and Explore Energy Futures Data” section.
Figure R.20: Condensate has an increasing share of NGL Production in the Evolving Policies Scenario

Description
Description: This graph shows total natural gas liquids (NGL) production from 2010 to 2050 in the Evolving Policies Scenario. Total production increases from 640 thousand barrels per day (Mb/d) in 2010 to 197 Mb/d in 2050. The majority of the increase in production comes from liquid condensate, which increases from 40 Mb/d in 2010 to 450 Mb/d in 2050.
Figure R.21 shows ethane that is extracted from the natural gas stream, and ethane that is not recovered (which includes ethane reinjected in the natural gas stream). Growth in ethane that is not recovered means there is growing potential to recover more ethane, in the event of future increases in the capacity of the ethane extraction and petrochemical facilities.Footnote 24
Figure R.21: Ethane Potential

Description
Description: This chart shows ethane production from natural gas processing and ethane not recovered from 2010 to 2050. Ethane production from gas processing is 236 thousand barrels per day (Mb/d) in 2010, 233 Mb/d in 2020, and 246 Mb/d in 2050. Ethane not recovered is 0 Mb/d in 2010, 151 Mb/d in 2020, and 167 Mb/d in 2050.
Figure R.22 shows total propane production broken out into its disposition. There are various uses of propane in Canada in all sectors, and over the next few years, petrochemical demand is projected to increase with the start of The Heartland Complex.Footnote 25 Propane exports to the U.S. have grown significantly this past decade as U.S. domestic demand and propane exports from the U.S. grew. In 2019, propane exports from the west coast of B.C. began, in the form of liquefied petroleum gas (LPG). These west coast exports could continue to increase, with potential for significant additional LPG projects and exports. Given recent export growth trends, and potential for petrochemical growth above what is projected, the Canadian propane market could see tightening in the longer term if propane production levels off then slightly declines, as projected in the Evolving Policies Scenario.
Figure R.22: Propane Disposition

Description
Description: This chart shows total propane production broken out into its disposition from 2010 to 2050. Projected exports are 160 thousand barrels per day (Mb/d) in 2020, 203 Mb/d in 2035, and 188 Mb/d in 2050. Oil sands solvent demand is 9 Mb/d in 2020, 15 Mb/d in 2035, and 15 Mb/d in 2050. Alberta petrochemical demand is 0 Mb/d in 2020, 22 Mb/d in 2035, and 22 Mb/d in 2050. Ontario petrochemical demand is 9 Mb/d in 2020, 76 Mb/d in 2035, and 77 Mb/d in 2050. Other Canadian demand is 91 Mb/d in 2020, 76 Mb/d in 2035, and 77 Mb/d in 2050. Total supply is 265 Mb/d in 2020, 322 Mb/d in 2035, and 307 Mb/d in 2050.
Key Uncertainties: NGLs
- Natural gas: NGLs are a byproduct of natural gas production, and as such, any uncertainty discussed in the natural gas section applies for NGL projections.
- Oil sands: The rate of oil sands and other heavy oil production growth, and the amount of blending, will affect the demand for condensate and butanes required for diluent. Likewise, the increased use of solvents to reduce steam requirements in the oil sands would increase demand for propane and butanes, and could influence how much they are targeted by future natural gas drilling.
- Petrochemical development: There is potential for ethane recovery to increase further if there is an increase in the capacity of ethane extraction and petrochemical facilities. This could be spurred by government programs, such as royalty credit incentives for petrochemical facilities in Alberta’s Petrochemicals Diversification Program.
- Global LPG export market: Several large-scale facilities have been approved by provincial and federal regulators to export LPG from B.C.’s coast. Propane exports from the B.C. coast began in May 2019 and butanes also became part of the LPG mix in April 2020. Over the outlook period, propane will likely be the majority of exported LPG. The amount and composition of the LPG stream exported at proposed and existing terminals could impact domestic NGL prices and the attractiveness of drilling for NGL-rich natural gas.
Electricity
In the Evolving Policies Scenario, electricity demand grows by 47% from 2021 to 2050, as shown in Figure R.23. This is driven by growth in all sectors, with transportation and hydrogen production being emerging growth areas. In transportation, electrification provides an alternative in a sector long-dominated by RPPDefinition * use. Hydrogen production is another growth area for electricity demand, as electricity is used in electrolysis to produce hydrogen.
Figure R.23: Electricity Demand Grows Steadily in the Evolving Policies Scenario

Description
Description: This chart breaks down total electricity demand by sector. From 2019 to 2050, residential electricity demand increases from 171 TWh in 2019 to 223 TWh by 2050. Commercial demand decreases from 150 TWh in 2019 to 134 TWh by 2050. Industrial demand increases from 239 TWh in 2019 to 279 TWh by 2050. Transportation demand increases from 1 TWh in 2019 to 93 TWh by 2050. Hydrogen Production demand increases from 0 TWh in 2019 to 90 TWh by 2050.
Currently, electricity makes up approximately 16% of Canada’s end-use energy demand. In the Evolving Policies Scenario, end-use electricity demand (excluding electricity to produce hydrogen) increases at an average annual rate of 1% over the projection period, which raises electricity’s share of end-use demand to nearly 30% by 2050. See Figure R.24.Footnote 26
Figure R.24: Share of Electricity in End-use Demand by Sector and Total in the Evolving Policies Scenario

Description
Description: This chart breaks down electricity’s share of total end-use demand, by sector. In 2020, electricity was 41% of total residential demand. This increases to 48% by 2030, 55% by 2040, and 64% by 2050. In 2020, electricity was 36% of commercial demand. This increases to 42% in 2030, 44% by 2040, and 53% in 2050. In 2020, electricity accounted for 14% of industrial demand. This increases to 15% by 2030, 18% by 2040, and 21% in 2050. In 2020, electricity accounted for 0% of transportation demand. This increases to 3% by 2030, 10% by 2040, and 19% in 2050. In 2020, total electricity demand was 17%. This increases to 20% by 2030, 24% by 2040, and 29% by 2050.
Canada has considerable renewable resource potential including hydro, wind, biomass, and solar. Over the past decade, there have been significant changes in Canadian electricity capacity and generation trends, and it continues to evolve in the EF2021 projections. Figure R.25 shows total Canadian installed capacity by fuel type, and Figure R.26 shows electric generation by fuel type. In the earlier part of the projection, renewables and natural gas replace phased out coal generation.Footnote 27 Coal falls faster than previous projections, as recent announcements from companies suggest coal will be phased out of the Alberta electricity mix by 2023. In the longer term, falling costs lead to large growth in non-hydro renewables such as wind and solar. Nuclear generation remains relatively stable overall in the projection, with some significant year-to-year variation because of Ontario’s nuclear refurbishments in the first half of the projection period. The share of low and non-emitting generation (renewables, nuclear, and fossil fuel with CCS) increases from 82% currently to 95% in 2050.Footnote 28
Wind and solar generation also increases in the Current Policies Scenario. However, given lower carbon prices and higher wind and solar costs, wind and solar increase to a lesser degree and there is a relatively higher share of natural gas generation compared to the Evolving Policies Scenario. In 2050, natural gas makes up 16% of total generation in the Current Policies Scenario. The share of renewables and non-emitting electricity increases to 83% by 2050, compared to 95% in the Evolving Policies Scenario.
Figure R.25: Electricity Capacity Grows Significantly in the Evolving Policies Scenario

Click to enlarge
Figure R.26: Electric Generation Trends by Primary Fuel Type in the Evolving Policies Scenario

Click to enlarge
Figure R.25 Description
Description: This stacked area chart shows electricity generation capacity by fuel type for the Evolving Policies Scenario from 2005 to 2050. Total generation capacity increases from 149 gigawatts (GW) in 2020 to 226 GW in 2050. Biomass and geothermal capacity increase from 2 GW in 2020 to 3 GW in 2050. Solar capacity increases from 3 GW in 2020 to 27 GW in 2050. Wind capacity increases from 14 GW in 2020 to 61 GW in 2050. Uranium capacity decreases from 13 GW in 2020 to 12 GW in 2050. Hydro / wave / tidal capacity increases from 81 GW in 2020 to 86 GW in 2050. Natural gas capacity increases from 24 GW in 2020 to 27 GW in 2050. Natural gas with CCS capacity increases from 0 GW in 2020 to 9 GW in 2050. Oil capacity decreases from 4 GW in 2020 to 4 GW in 2050. Coal and coke capacity decreases from 8.5 GW in 2020 to 0 GW in 2050.
Description: This stacked area chart shows electricity generation capacity by fuel type for the Evolving Policies Scenario from 2005 to 2050. Total generation capacity increases from 149 gigawatts (GW) in 2020 to 226 GW in 2050. Biomass and geothermal capacity increase from 2 GW in 2020 to 3 GW in 2050. Solar capacity increases from 3 GW in 2020 to 27 GW in 2050. Wind capacity increases from 14 GW in 2020 to 61 GW in 2050. Uranium capacity decreases from 13 GW in 2020 to 12 GW in 2050. Hydro / wave / tidal capacity increases from 81 GW in 2020 to 86 GW in 2050. Natural gas capacity increases from 24 GW in 2020 to 27 GW in 2050. Natural gas with CCS capacity increases from 0 GW in 2020 to 9 GW in 2050. Oil capacity decreases from 4 GW in 2020 to 4 GW in 2050. Coal and coke capacity decreases from 8.5 GW in 2020 to 0 GW in 2050.
Figure R.26 Description
Description: This stacked area chart shows electricity generation by fuel type for the Evolving Policies scenario. Total generation increases from 624 terrawatt hours (TWh) in 2020 to over 819 TWh in 2050. Biomass and geothermal generation stays at 8 TWh from 2020 to 2050. Solar generation increases from 2 TWh in 2020 to 35 TWh in 2050. Wind generation increases from 35 TWh in 2020 to 159 TWh in 2050. Uranium generation increases from 83 TWh in 2020 to 96 TWh in 2050. Hydro / Wave / Tidal generation increases from 386 TWh in 2020 to 446 TWh in 2050. Natural gas generation decreases from 74 TWh in 2020 to 36 TWh in 2050. Natural gas with CCS generation increases from 0 TWh in 2020 to 33 TWh in 2050. Oil generation increases from 4 TWh GW in 2020 to 6 TWh GW in 2050. Coal and coke generation decreases from 31 TWh GW in 2020 to 0 TWh GW in 2050.
The increase in non-hydro renewables is driven by falling costs, technological improvements, and improved integration of variable renewable energyDefinition * sources such as wind and solar. Figure R.27 shows that by 2050, wind and solar capacity is added in a variety of Canadian regions. Total wind capacity rises to over 57 GW and total solar capacity rises to 26 GW. Post 2030, solar is the fastest growing renewable.
Figure R.27: Increasing Capacity of Non-Hydro Renewables in the Evolving Policies Scenario

Description
Description: This chart shows total non-hydro renewable capacity in the Evolving Policies Scenario. Solar capacity increases from 0.04 GW in 2020 to 7.08 GW by 2050, wind capacity increases from 1.47 GW in 2020 to 16.29 GW by 2050.
Integration of increasing wind and solar–whose generation is variable due to changing wind and sun conditions–is supported in a number of ways in the Evolving Policies Scenario. Other forms of energy, such as hydropower and natural gas, help back up these non-hydro renewables. In the Evolving Policies Scenario, energy interconnection between provinces will increase, including between Manitoba-Saskatchewan and Alberta-B.C. This adds to significant trade in Eastern and Atlantic Canada, which could increase further if projects such as the proposed Atlantic Loop increase transmission capacity. This increased ability to exchange power helps regions integrate larger amounts of variable wind and solar energy. Finally, the Evolving Policies Scenario includes around 25 GW of utility scale battery storage. This level is based on the falling costs of storage, as well as the falling costs of renewables, especially solar. Storage is particularly critical for large additions of solar.
Canada is a net exporter of electricity to the U.S., and large amounts of electricity are also traded between provinces, mainly in eastern Canada. By connecting the electricity grids of different regions, grid operators can take advantage of regional differences in electricity mixes, available variable renewable energy, and periods of peak electricity demand. Figure R.28 shows projected net exports out of Canada, as well as aggregate interprovincial trade volumes. Trade remains relatively small when compared to total generation.Footnote 29
Figure R.28: Net Exports of Electricity and Interprovincial Trade

Description
Description: This graph shows interprovincial and international electricity trade for 2020, 2030, 2040 and 2050 in the Evolving Policies scenario. Interprovincial out-flows are 50.9 TWh in 2020, 57.4 TWh in 2030, 62.4 TWh in 2040, and 58.9 TWh in 2050. Net exports are 57.3 TWh in 2020, 36.2 TWh in 2030, 45.1 TWh in 2040, and 41.3 TWh in 2050.
Key Trends: Electricity Generation
- Technologies enabling Canada’s transition to a low-carbon economy make inroads across the energy system, particularly in electricity generation.
- Natural gas and renewable generation is added, and most nuclear will be refurbished.
- Coal will be phased out.
- In the Evolving Policies Scenario, the share of non- and low-emitting generation increases from 82% currently, to 95% in 2050.

View our data on electricity by region, source, and scenario in our interactive visualization tool, Exploring Canada’s Energy Future.
Explore a summary of electricity production in our EF2021 Fact Sheets: Electricity.
Key Uncertainties: Electricity Generation
- Future cost declines of generating technology: The costs associated with different generating technologies is an important factor in determining what type of facilities are built. This is especially true with rapidly changing technologies such as wind, solar, and battery storage.
- Renewable enabling technologies: Deployment of technologies to improve the integration of variable renewable energy, such as smart grids, storage, and transmission, could allow for greater levels of wind and solar in the projections.
- Electricity demand growth: This is important in determining future electricity supply. As a result, the uncertainties identified in the energy demand section are uncertainties that also apply to the electricity supply projections.
- Export market developments: Climate policies, fuel prices, electrification and power sector decarbonization in export markets could impact future projects and transmission developments.
Hydrogen
In recent years there has been increasing interest in low-carbon hydrogen as an important fuel in Canada and the world’s transition to a low-carbon economy. Over the past few years, many countries including Canada, have released hydrogen strategies. EF2021 is the first edition of the Canada’s Energy Future series with a dedicated section on hydrogen supply and demand, and also introduces a hydrogen table in our online data appendix.
Our focus in this section is on hydrogen use as an energy carrier and produced by methods that emit little or no CO2.Footnote 30 In the Current Policies Scenario, we include only currently announced projects.
In the Evolving Policies Scenario, total hydrogen demand reaches 4.7 megatonnes (MT), or 565 PJ, by 2050, as shown in Figure R.29. This accounts for 6% of total end-use energy demand. By 2050, the industrial sector accounts for 65% of hydrogen use. In this sector, hydrogen is mainly used in steel manufacturing, oil sands production, and chemical and fertilizer production. The transportation sector accounts for 25% of hydrogen demand, mostly displacing diesel in long distance freight trucking and marine transportation. The final 10% of hydrogen is used in the residential and commercial sectors, where it is blended into the natural gas stream and used for space and water heating.
Figure R.29: Hydrogen Demand by Sector

Description
Description: This chart shows hydrogen demand for the commercial, industrial, residential, and transportation sectors in the Evolving Policies Scenario. In 2030, commercial demand is 0.01 megatonnes (MT), industrial demand is 0.12 MT, residential demand is 0.1 MT, and transportation demand is 0.03 MT. In 2035, commercial demand is 0.06 MT, industrial demand is 0.95 MT, residential demand is 0.05 MT, and transportation demand is 0.07 MT. In 2040, commercial demand is 0.14 MT, industrial demand is 2.41 MT, residential demand is 0.14 MT, and transportation demand is 0.24 MT. In 2045, commercial demand is 0.26 MT, industrial demand is 3.11 MT, residential demand is 0.27 MT, and transportation demand is 0.59 MT. In 2050, commercial demand is 0.23 MT, industrial demand is 3.09 MT, residential demand is 0.27 MT, and transportation demand is 1.12 MT.
Figure R.30 shows hydrogen demand by province. Hydrogen demand is the highest in Alberta, which accounts for 53% of total hydrogen demand in 2050. Alberta’s relatively high demand is due to its existing industrial makeup, and its ability to produce hydrogen from natural gas with CCS, which has relatively lower costs than electrolysis earlier in the projection period. Alberta’s future hydrogen use is mainly in oil sands production, where it is used to replace natural gas as a source of process heat. By 2050, hydrogen demand in Alberta’s industrial sector accounts for 76% of the province’s total demand.
Figure R.30: Hydrogen Demand by Region

Description
Description: This chart shows hydrogen demand by region in the Evolving Policies Scenario. Total demand is 0 megatonnes (MT) in 2020. In 2030, Alberta demand is 0.13 MT, British Columbia demand is 0.03 MT, Ontario demand is 0.003 MT, Quebec demand is 0.002 MT, and Saskatchewan demand is 0.07 MT. In 2040 Alberta demand is 2.29 MT, British Columbia demand is 0.24 MT, Ontario demand is 0.18 MT, Quebec demand is 0.06 MT, and Saskatchewan demand is 0.12 MT. In 2050, Alberta demand is 2.5 MT, British Columbia demand is 0.35 MT, Ontario demand is 1.08 MT, Quebec demand is 0.29 MT, and Saskatchewan demand is 0.22 MT.
Given that we assume hydrogen is produced to meet local demands (with no international or inter-provincial trade), hydrogen production aligns with demand. Accordingly, in the Evolving Policies Scenario, Canada produces 4.7 MT of hydrogen by 2050, matching domestic demand, and Alberta is the largest producer (with 2.5 MT of production in 2050).
In the early years of the projection, natural gas with CCS is the dominant technology for hydrogen production. Electrolysis powered by electricity from the grid and dedicated renewables becomes cost competitive towards the end of the projection. By 2050, natural gas with CCS makes up 57% of total production (Figure R.31). Production from electrolysis powered by dedicated renewables and the grid make up 33% and 9% respectively. Most regions in Canada produce hydrogen using electrolysis powered by electricity from the grid or dedicated renewables. Ontario has the highest hydrogen production from electricity, with 54% of Canada’s electrolysis-based total. By 2050 close to 90 TWh of electricity is used to produce 1.8 MT of hydrogen. Similarly, natural gas with CCS uses over 422 PJ of natural gas to produce 2.69 MT of hydrogen.
Figure R.31: Hydrogen Production by Technology

Description
Description: This chart shows hydrogen production by technology in the Evolving Policies Scenario for 2030, 2035, 2040, 2045, and 2050. In 2030, natural gas with CCS production is 0.1 megatonnes (MT), renewable electrolysis is 0.01 MT, and grid electrolysis is 0.003 MT. In 2035, natural gas with CCS production is 0.75 MT, renewable electrolysis is 0.12 MT, and grid electrolysis is 0.03 MT. In 2040, natural gas with CCS production is 2.03 MT, renewable electrolysis is 0.45 MT, and grid electrolysis is 0.13 MT. In 2045, natural gas with CCS production is 2.48 MT, renewable electrolysis is 1.26 MT, and grid electrolysis is 0.33 MT. In 2050, natural gas with CCS production is 2.54 MT, renewable electrolysis is 1.58 MT, and grid electrolysis is 0.44 MT.
Key Uncertainties: Hydrogen
- Infrastructure: Development of new and existing infrastructure will have an impact on the pace of hydrogen adoption in all sectors. The maximum amount of hydrogen that can be safely blended in existing infrastructure is limited to a portion of the existing pipeline capacity.
- Trade: Interprovincial and international trade could alter the hydrogen supply and demand projections in this chapter. Many factors will influence the extent of trade, including whether existing transportation infrastructure is adapted to carry hydrogen, new infrastructure is built primarily for hydrogen transportation, and the evolution of costs between technologies and regions.
- Future cost declines of production technology: large-scale low-carbon hydrogen production will depend on production technologies’ cost decline associated with electrolyzers, CCS technology, storage, and distribution. The relative cost between various production methods will also be important, as different regions have different characteristics such as accessibility to storage, and wind and solar resource quality.
- Carbon intensity: For hydrogen derived from natural gas to play a role in decarbonization, its associated emissions need to be low. Carbon capture rates greater than 90%, as assumed in this analysis, will be important. Other important areas include reducing emissions from natural gas production, including methane emissions, which are currently covered by various provincial and federal policy initiatives.
Greenhouse Gas Emissions
Currently, energy use and GHG emissions in Canada are closely related. ECCC produces Canada’s official emission projections for the United Nations Framework Convention on Climate Change.Footnote 31
The majority of GHGs emitted in Canada are a result of fossil fuel combustion. Fossil fuels provide much of the energy used to heat homes and businesses, transport goods and people, and power industrial equipment. Energy related emissions accounted for 82% of Canadian GHG emissions in 2018.Footnote 32 The remaining emissions are from non-energy sources such as agricultural and industrial processes and waste handling.
Does the Evolving Policies Scenario Meet Canada’s Climate Commitments?
The Evolving Policies Scenario provides an energy supply and demand outlook for Canada under the general premise that global and domestic climate action continues to increase at its recent pace. EF2021 focuses on potential future outcomes for Canada’s energy system. It should not be viewed as an assessment, or a pathway, for meeting Canada’s climate commitments.
ECCC produces the official analysis of Canada’s current emissions outlook and performance against its climate commitments. Recent ECCC projections included in Canada’s updated Nationally Determined Contribution (NDC)Footnote 33 show that with the latest measures in the Strengthened Climate Plan and Budget 2021, a GHG emission reduction of 36% below 2005 levels by 2030 is achieved. This reduction exceeds Canada’s original NDC pledge of 30% below 2005 levels, but additional measures could be needed to hit the updated NDC of 40-45% below 2005 levels.
The unabated fossil fuel demand trends in the Evolving Policies Scenario, as shown in this section, imply significant reduction in GHG emissions. They also imply that the Evolving Policies Scenario is unlikely to achieve net-zero emissions by 2050. Recognizing this fact, we have included the “Towards Net-Zero” section in EF2021.
Key Trends: Fossil Fuel Use and GHG Emissions
- Overall unabated fossil fuel use declines in the Evolving Policies Scenario.
- Natural gas, oil, and coal each have their own distinct future trend, but use of all three falls over the long-term.
- The emission intensity of fossil fuel use falls, driven by the phase out of coal and the long-term adoption of
CCSDefinition *.
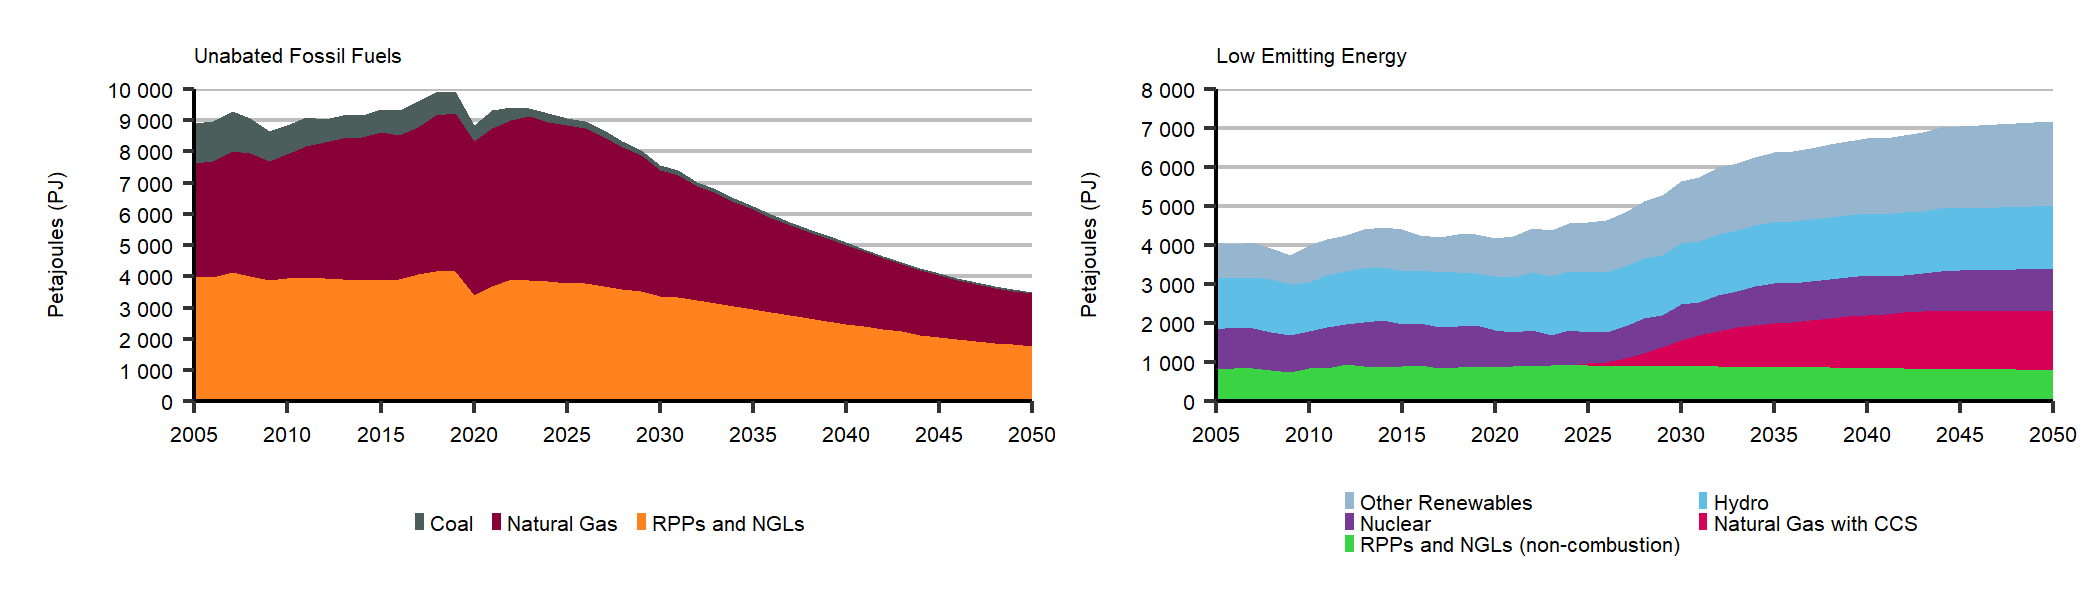
Figure R.32 breaks out total primary demand into unabated fossil fuel demand, which will make up the majority of Canadian GHG emissions, and low emission sources, which include renewable, nuclear, fossil fuels with CCS, and fossil fuels for non-combustion purposes.Footnote 34 Relative to 2019 levels, unabated fossil fuel consumption is 19% lower in 2030, 45% lower in 2040, and 62% lower in 2050. Meanwhile, low-emission energy rises, and accounts for 67% of energy use in 2050, compared to just 31% in 2021.
Trends vary among fossil fuels. Coal consumption significantly declines over the projection, driven by its phase-out from electricity generation by 2030.Footnote 35 Use of RPPs, such as gasoline and diesel, gradually declines throughout the projection period. In the earlier years, this decline is driven by efficiency improvements and increased blending of biofuels, and in the long term is driven by increased electrification of the transportation sector. Use of natural gas continues to grow in the very early part of the projection period, following its increased role in power generation and its use in rising oil sands production. In the longer term, its overall use falls but its use with CCS increases significantly for industrial and power generation use and low-carbon hydrogen production.
Figure R.32: Total Primary Demand by Type
Description
Description: This figure is composed of two charts. The first chart shows primary demand for unabated fossil fuels from 2005 to 2050. Coal demand is 936 petajoules (PJ) in 2010, 160 PJ in 2030, and 58 PJ in 2050. Natural gas demand is 3 957 PJ in 2010, 4 033 PJ in 2030, and 1 669 PJ in 2050. Demand for refined petroleum products (RPPs) and natural gas liquids (NGLs) is 3 953 PJ in 2010, 902 PJ in 2030, and 1 788 PJ in 2050. The second chart shows primary demand for low emitting fuels. Hydro demand is 1 254 PJ in 2010, 1 564 PJ in 2030, and 1 607 PJ in 2050. Nuclear demand is 955 PJ in 2010, 916 PJ in 2030, and 1 073 PJ in 2050. Natural gas with CCS demand is 0 PJ in 2010, 667 PJ in 2030, and 1 512 PJ in 2050. Demand for non-combustion RPPs and NGLs is 0 PJ in 2010, 902 PJ in 2030, and 814 PJ in 2050. Demand for other renewables is 931 PJ in 2010, 1 601 PJ in 2030, and 2 144 PJ in 2050.
Changing proportions of which fossil fuels are consumed leads to declining combustion-related GHG emissions per unit of fossil fuel energy used in the Evolving Policies Scenario, particularly with coal use declining to 2030. Deployment of CCS technology in industrial facilities also reduces the GHG intensity of fossil fuel use in the longer term. As shown in Figure R.33, fossil fuel emission intensity in 2030 is 9% lower than 2019, and 16% lower than 2005 in the Evolving Policies Scenario. By 2050 it is 29% lower than 2019, and 35% lower than 2005 in the Evolving Policies Scenario. This decline drives emission reductions when combined with falling fossil fuel use, as 2030 total fossil fuel use is 16% lower than 2019, and 6% lower than 2005. By 2050, total fossil fuel use is 46% lower than 2019, and 40% lower than 2005. Accounting for reductions in non-combustion emissions, such as reducing methane emissions, as well as including emission credits purchased through international trading mechanisms (like Quebec’s emission trading with California), could further decrease emission intensity.
Figure R.33: Fossil Fuel Emission Intensity Falls due to Higher Shares of Natural Gas, Less Coal, and Greater Adoption of CCS in the Evolving Policies Scenario

Description
Description: This chart shows emissions intensity in grams of carbon dioxide equilivent per megajole (gCO2e/MJ) from 2005 to 2050. In 2005, emissions intensity was 64 gCO2e/mj. This declined to 60 gCO2e/mj in 2018, and declines to 42 cGO2e/mj in 2050.
Could Carbon Removals Bring Canada to Net-Zero in the Evolving Policies Scenario?
Global and domestic net-zero pathway exercises rely on some degree of carbon removal or negative emission technology to reach net-zero by 2050. The degree varies depending on the scenario and underlying assumptions. For example, the Net‐Zero Emissions by 2050 Scenario in the IEA’s Net-Zero by 2050 report includes about 1.9 gigatonnes of CO2 that is removed by negative emissions technologies in 2050. In the Canadian context, the Canadian Institute for Climate Choices’ Canada's Net Zero Future report shows availability of engineered negative emission technologies, particularly direct air capture, and accounts for 0 to 425 MT of CO2 emission reductions in 2050 across the 62 scenarios they analyzed. However, the Canadian Institute for Climate Choices recognizes potential challenges, both technical and economic, and identifies ways to reach net-zero in the absence of negative emissions technologies.
Negative emissions technologies and enhanced biological sinks involve removing CO2 from both the emissions’ source and the atmosphere, and storing it in land, ocean, or geological reservoirs.Footnote 36 While hypothetically promising, most assessments agree that negative emissions technologies are not a replacement for conventional mitigation and adaptation methods, due to high costs, potential risks, and uncertainties involved.Footnote 37
Notable GHG removal methods include:
Reforestation and afforestationFootnote 38: Carbon can be sequestered in biomass through restocking of existing forests and woodlands that have been depleted, or introducing trees to areas that have not previously been forested.
Soil carbon sequestrationFootnote 39:Carbon can be removed from the atmosphere and stored in the soil carbon pool, primarily in the form of soil organic carbon. This can be accomplished through a variety of methods, including the restoration of degraded soils or widespread adoption of soil conservation practices in agriculture. For instance, reducing soil carbon loss can be achieved in certain circumstances by switching from tillage to no-till cropping.
Bio-energy with carbon capture and storage (BECCS)Footnote 40: Carbon can be captured and stored by geological sequestration or land application, as energy is extracted from biomass through combustion, fermentation, or other conversion methods. Limiting factors for BECCS include the availability and sustainability of feedstock biomass, and the availability of carbon storage capacity.
Direct air capture: Carbon can be captured from the atmosphere to produce a concentrated stream of CO2. It can then be sequestered (resulting in emission removals), or used to make carbon-neutral synthetic fuels. Direct air capture uses a lot of energy, so large-scale deployment could impact energy supply and demand trends.
The Evolving Policies Scenario shows a 60% drop in unabated fossil fuel use by 2050, which would result in a significant reduction in emissions. The Evolving Policies Scenario does not include assumptions related to deployment of large-scale carbon removals. Whether the Evolving Policies Scenario could be net-zero with deployment of carbon removals depends on two key considerations:
- Although unabated fossil fuel use falls, it is still a significant part of the energy mix, and implies significant levels of emissions. This would require a large deployment of carbon removal technology. The feasibility of this deployment would depend on many factors, including cost reductions of emerging technologies such as direct air capture, and the availability and costs of BECCS and nature-based solutions. Given these are emerging solutions, large deployment is highly uncertain.
- Deployment of large-scale carbon removals would likely change the Evolving Policies Scenario projections. For example, large-scale direct air capture deployment would involve a significant increase in natural gas and/or electricity use. Likewise, a large deployment of BECCS could change the Evolving Policies Scenario electricity projections.
Given the uncertainty with removal technologies, especially at large-scales, and the fact that large-scale removals would affect the projections, the Evolving Policies Scenario as described in this section should not be considered a net-zero pathway.
- Date modified: